.
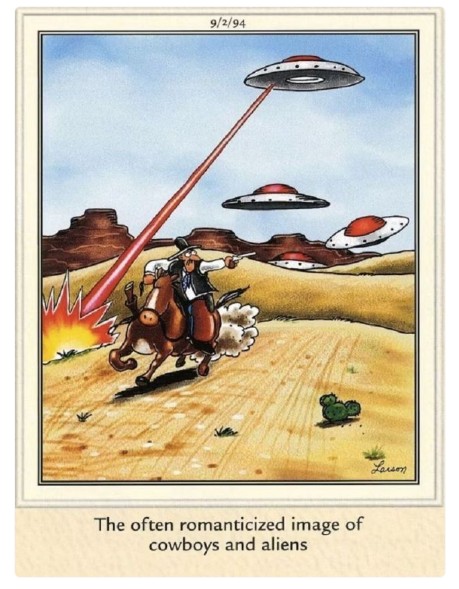
In preparation for the “space buzz,” MarketCycle bought a 4% allocation to the ETF of “UFO” (aerospace) for client accounts in the very beginning of April, well before the IPO date was announced for SpaceX. This is a strong fund that steadily outperforms the S&P-500 and it is generally performing well.
.

.
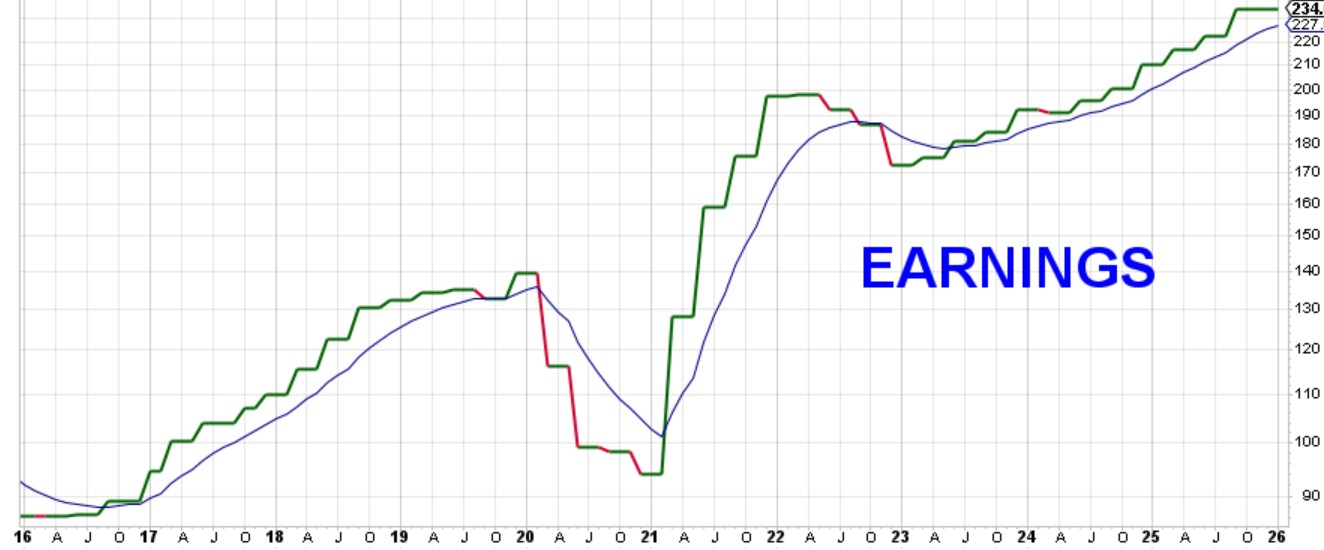
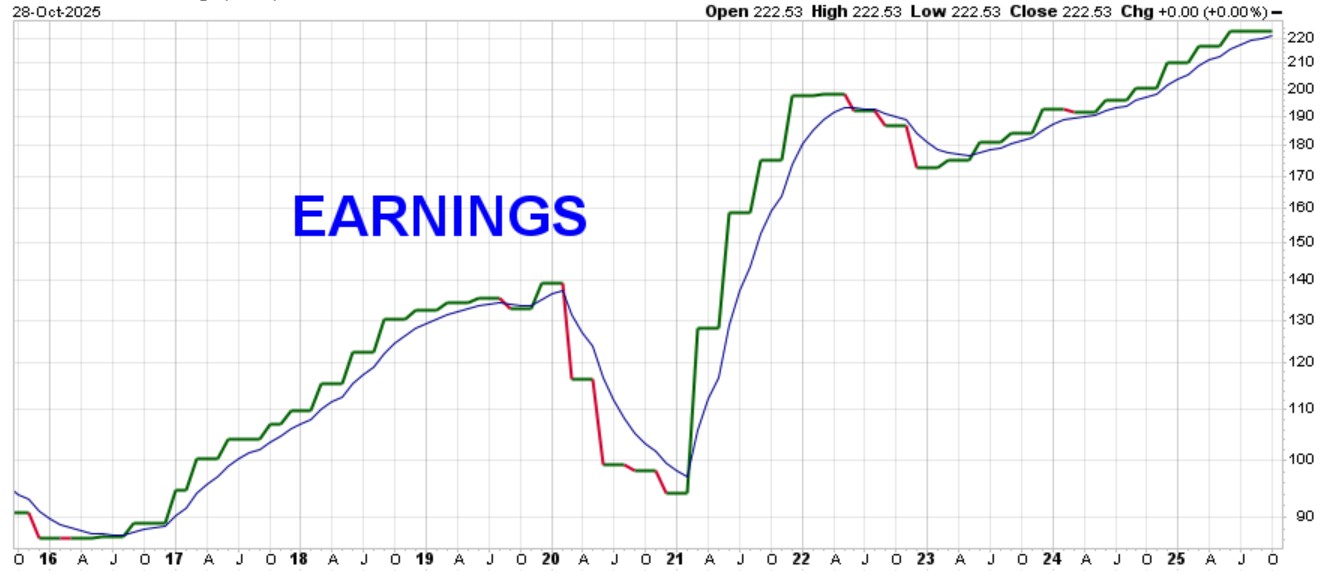
Stock ownership represents partial ownership in a company. You own a piece of the action. Stocks move higher and generate investor profits based on positive and growing earnings… but only if the stock is publicly available to be purchased, which leads us to…
SpaceX will likely go public via its IPO (Initial Public Offering) in mid-June (12th?). Its day-one target valuation is a ridiculous $1.8-trillion and this is for a 4-part company that makes no money; all combined, this 4-part package LOSES $10.5-billion per year with no hint of a coming profit in the near-term.
- X (Twitter)… currently loses $24-billion per year
- xAI (artificial intelligence)… currently loses $2.5-billion per year
- The rocket business… earns $4-billion per year
- Starlink satellites (the “Comcast of space”)… earns $12-billion per year
$16,000,000,000 positive earnings – $26,500,000,000 negative loss = a total loss of $10.5-billion per year (and SpaceX is being offered up to the public for approximately $1.8-trillion). Such a deal!
Please understand that I am talking about the current earnings of the company. SpaceX may eventually have strong earnings and a high valuation, perhaps even bigger than Nvidia by 2029(?)… but that is not happening in the near-term. The IPO likely goes parabolic on day one and it then likely moves lower over the subsequent (12?) weeks.
The Nasdaq-100 (and likely the S&P-500), until Musk had a face-to-face meeting with them, required 3 months before an IPO could be listed on their indexes. This is because almost all IPOs soar in price on day one and then plummet after the initial period of euphoria suddenly ends. Usually, if an IPO hits $300 per share on its IPO date, it is often worth just $100 three months later, so the indexes have learned to wait for 3 months before listing the new stock on their indexes. But after a private talk with Musk, they suddenly require only 15 days to list on their indexes, so SpaceX (stock symbol: SPCX) will be listed in the Nasdaq-100 (and very likely the S&P-500 and possibly other large-cap indexes) in late-June. The indexes, the big banks, the brokerage houses and Musk are all set up to make a lot of fast money. Musk will be the first “Trillionaire” in the history of the universe.
Generally, Elon Musk does not create companies from the ground up, he buys already established companies, eliminates all mention of the founders, and then runs them as his own. His genius actually lies in his ability to see what the future may look like. His stupidity lies in ignoring the perils inherent in his vision of how things progress.
SpaceX will almost instantly become roughly 3% of each index. This means that every single person that holds the Nasdaq-100 index or the S&P-500, which includes almost ALL global investors, plus all 401-k plans, will become mandatory buyers & holders of SpaceX exactly 15 days after its IPO is introduced. Musk found a way to create a purely “instant” and “manufactured” and “mandatory” and “ongoing” demand for his stock (but again, its actual price may still drop when investors realize that it is grossly overvalued in the near-term).
The icing on the cake (for Elon) is that it currently looks as if Musk will now be allowed to sell portions (tranches) of his personal shares much earlier than normal (several weeks rather than having to wait many months?) and he owns a lot of this new SpaceX company; he will still control 85% of his company (after he includes Tesla into the mix) even after it goes public.
It pays to be an Oligarch in the New Kingdom of the United States where much of his personal company development was paid for by the U.S. taxpayer. You and I expanded SpaceX via our $50-BILLION taxpayer funded “Government-Grant Gifts.” Now we get to pay for shares of his company.
Bottom line: Even if you do not directly buy SpaceX (using the symbol of SPCX) you are likely to own up to a 3% chunk of it (15 days post-IPO) in your stock-index ETFs (or mutual funds) such as QQQ or SPY or VOO. SpaceX is likely to do well around its IPO date on June 12th, but it may then go on the lose as much as 50% of its initial gains during the subsequent three months.
.
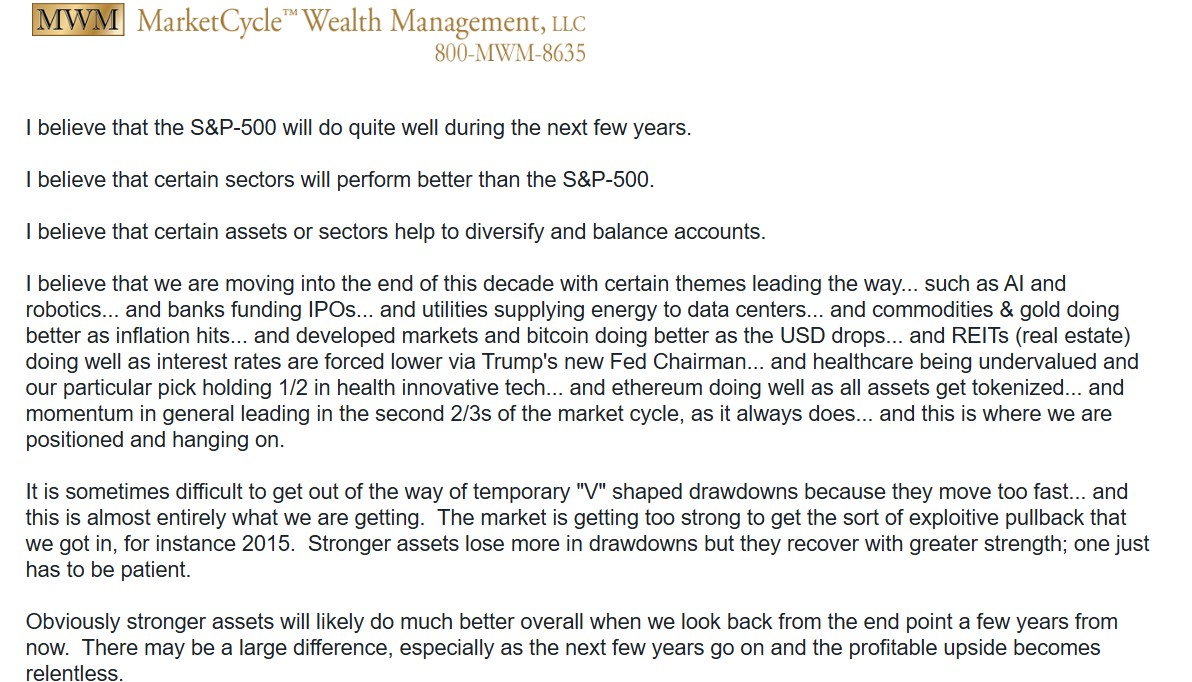
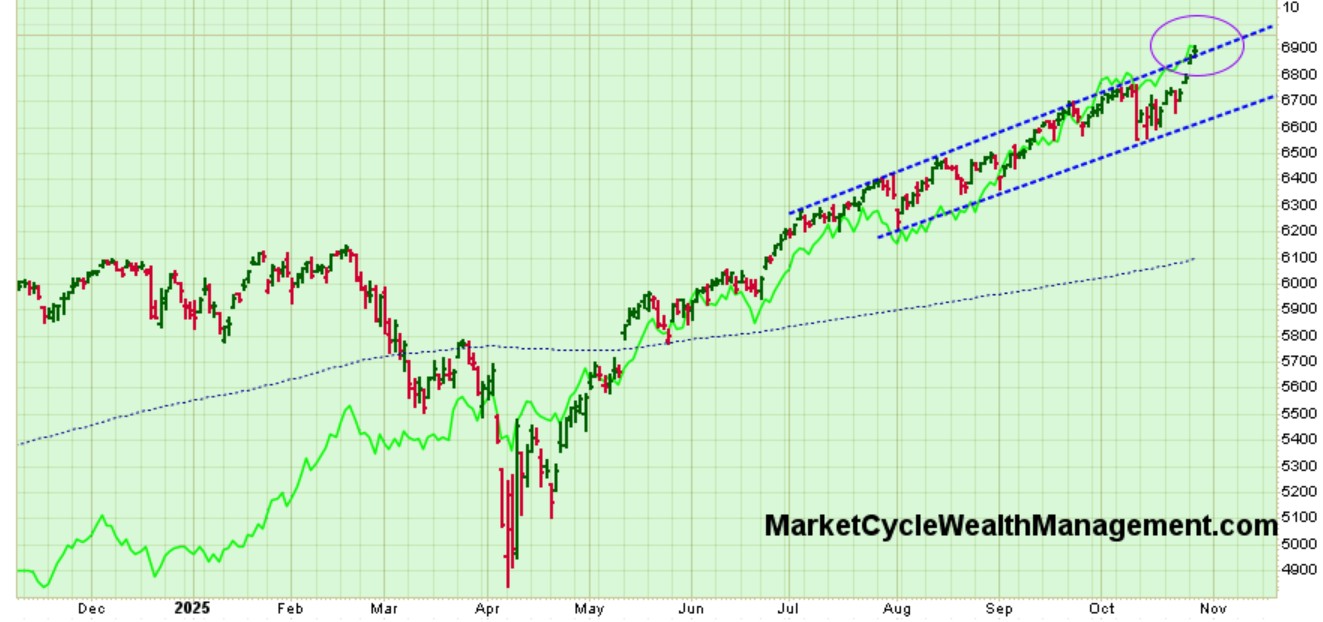
SUMMARY: Still bullish! Risk is just at normal levels, we keep hitting record highs, MarketCycle’s positioning is beating the market, the overall stock market likely wants to go even higher before eventually correcting, future corrections are likely to be temporary “V” shaped until the very end of this secular/cyclical bull market, and there are a lot more opportunities out there than normally exist! Very bullish!!
.
.
Thanks for reading!
MarketCycle Wealth Management is in the business of navigating your investment account smoothly through turbulence. The final years of this secular/cyclical bull market bubble will likely be highly profitable. We strive hard to earn our keep and to make our small management fee disappear into profits generated. It is easy to become a client.
.
MARKET CYCLE — SECULAR BULL MARKET — MOMENTUM — RELATIVE STRENGTH — HEDGE FUNDS