MarketCycle Wealth Management

MarketCycle’s current prediction on the S&P-500 price @ “end-of-year,” the same prediction that we have held literally all year: S&P-500 back to 4800 by New Years Day (or very early in 2024). I explain how/why below. This prediction is an educated opinion and it is not a guarantee, but it would take a pretty bad news event to temporarily derail it.
[ There is a new print/PDF function at the bottom, on the web page. ]
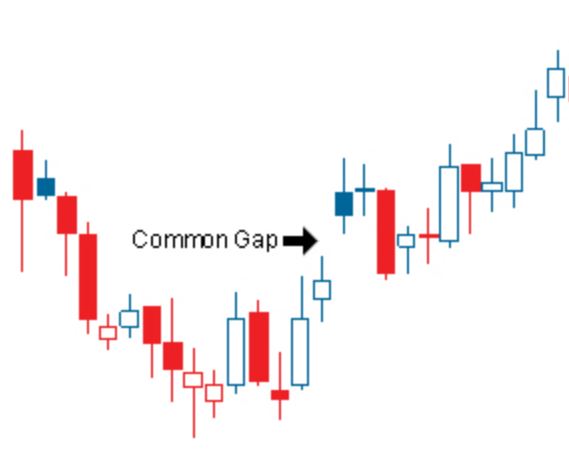
Gaps: The popular and complex investing technique of technical analysis (TA) offers predictions on where the markets are headed. Much of TA works via a self-fulfilling prophecy. If 50-million technical analysis investors are looking at the same thing on a chart and uniformly believe that what they are seeing indicates that a certain outcome is about to happen, and if they all buy or sell stocks in unison as a reaction to what they see on the chart, then they will CAUSE the ‘predicted’ thing to actually occur. Breakaway and runaway gaps are an example; this is shown below.
Most ‘gaps’ are just space on a price chart that is either pre-filled or eventually back-filled and these are called ‘common gaps’ and they are not that important. They are shown both above and below. But some gaps are very important and they represent a market that is about to go vertical and these are called ‘breakaway gaps’ which are always followed by one or more (mid-move) ‘runaway gaps’. They normally get investors very excited and they then begin to aggressively buy stocks with sideline cash, which is plentiful right now. We have very recently seen these rare gaps on the price chart of the S&P-500. They do not have to be back-filled and in fact, they usually indicate that the market wants to move higher.
Of importance, this works a disproportionate amount of the time, but not always…. right now, the market is a bit overbought and some important market-moving economic data arrives in early December. So, before heading higher, the stock market might temporarily gyrate in a fairly narrow band, sideways.
.
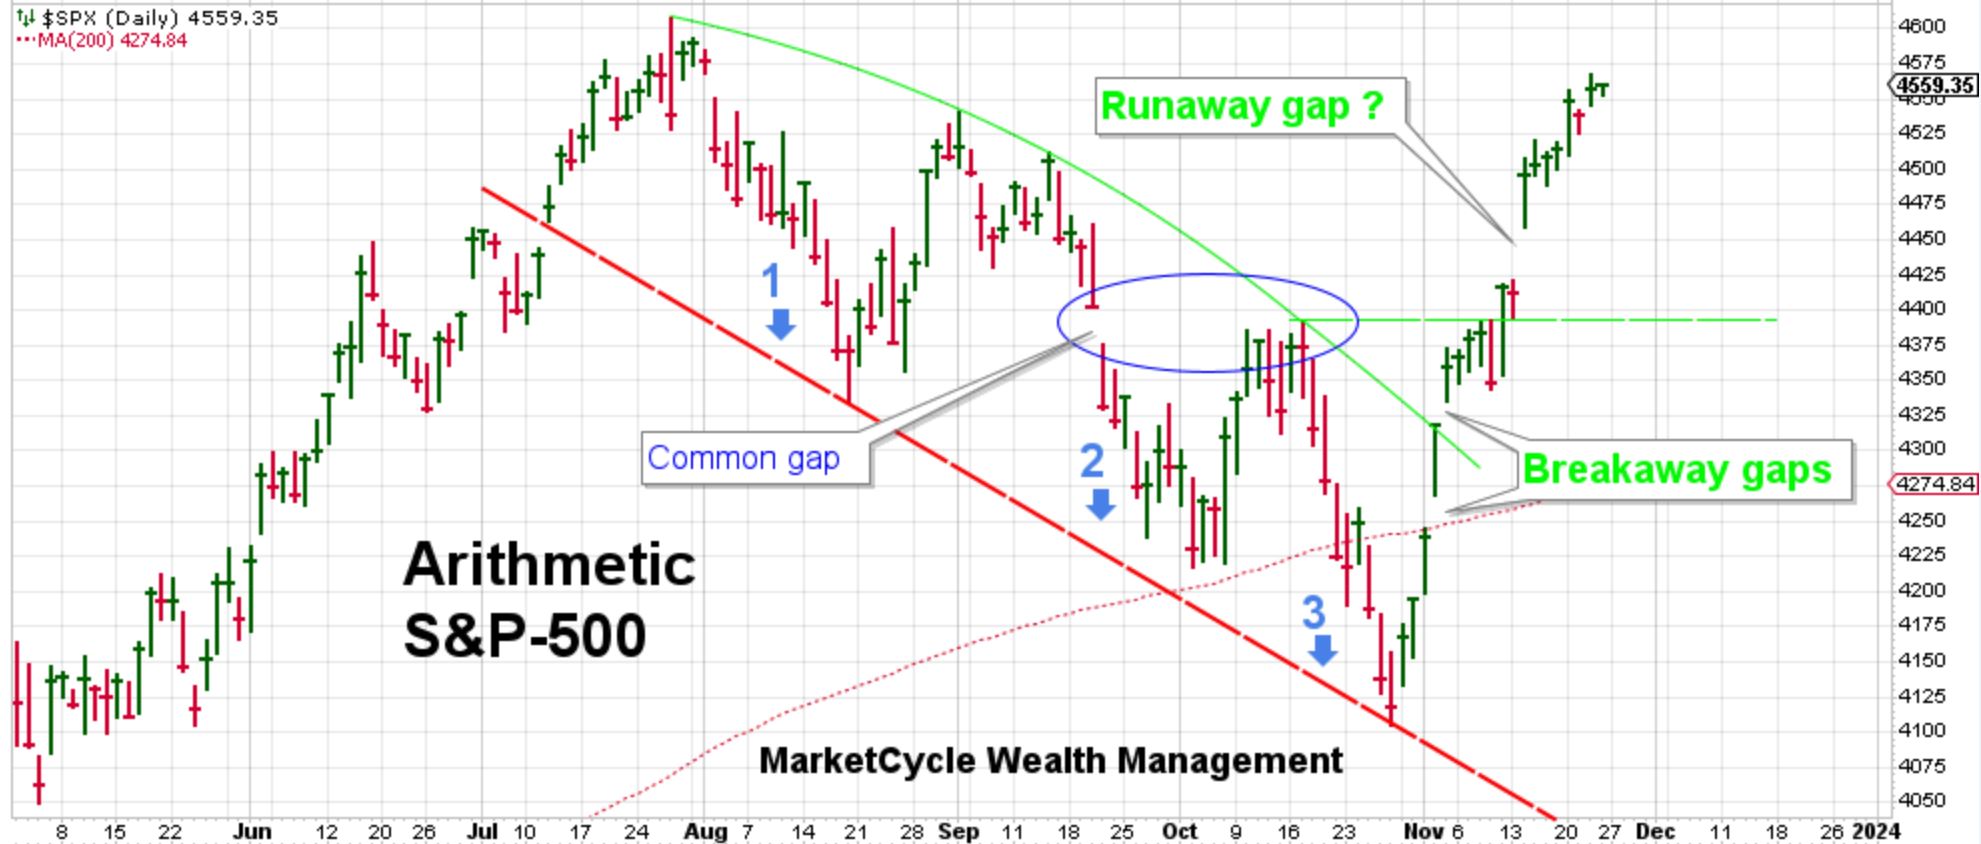
This first chart shows the recent gaps in the S&P-500. Again, ‘common gaps’ are common and they are always pre-filled or eventually back-filled and they are generally of very short-term significance. Rare ‘breakaway gaps’ that are followed by ‘runaway gaps’ suggest a strong market that is likely to continue to travel higher and that is important. So far, that is what has happened.
This chart shows the past 1/2 year of fairly chaotic market action, but with extreme near-term upward strength. The market has recovered 3 months of losses in just 3 weeks. (Chart posted on 11/25/2023):
.
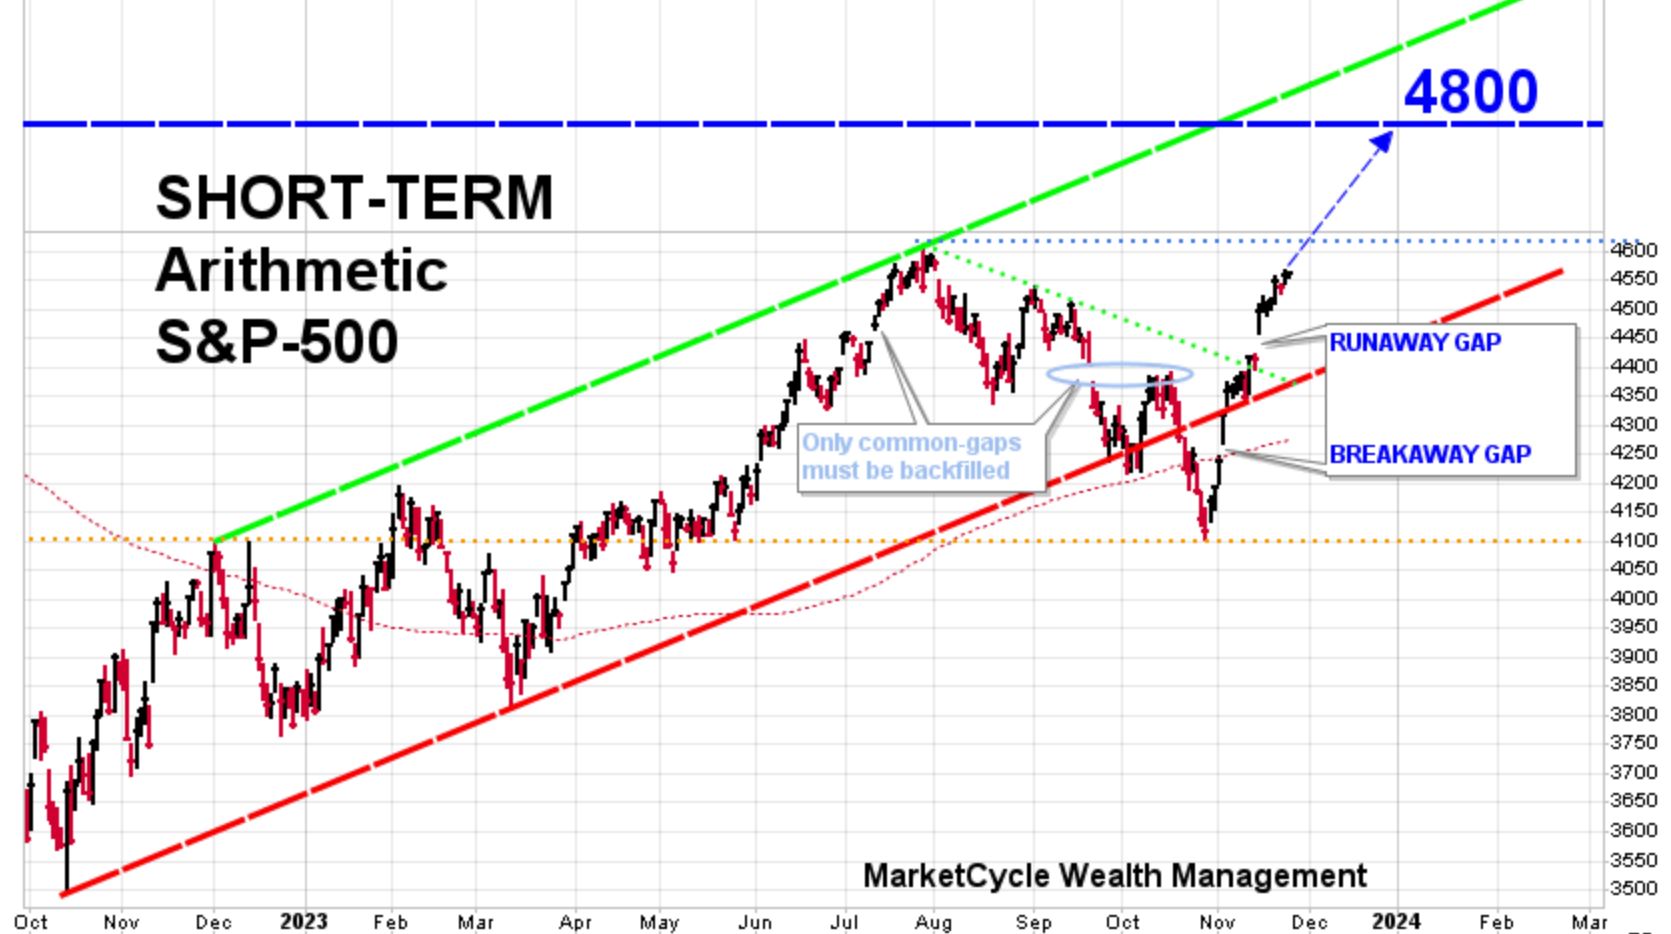
Measuring the vertical height of the price move from late October to today suggests a continued move to 4800. When the S&P-500 surpasses 4800, and it will, this would represent a new record high for the stock market. Think about that… the highest in the history of the universe and this very well might occur within the next few months.
This next chart shows the past year and indicates MarketCycle’s projected target of 4800 for end-of-year, or early in 2024. (Chart posted on 11/25/2023):
.
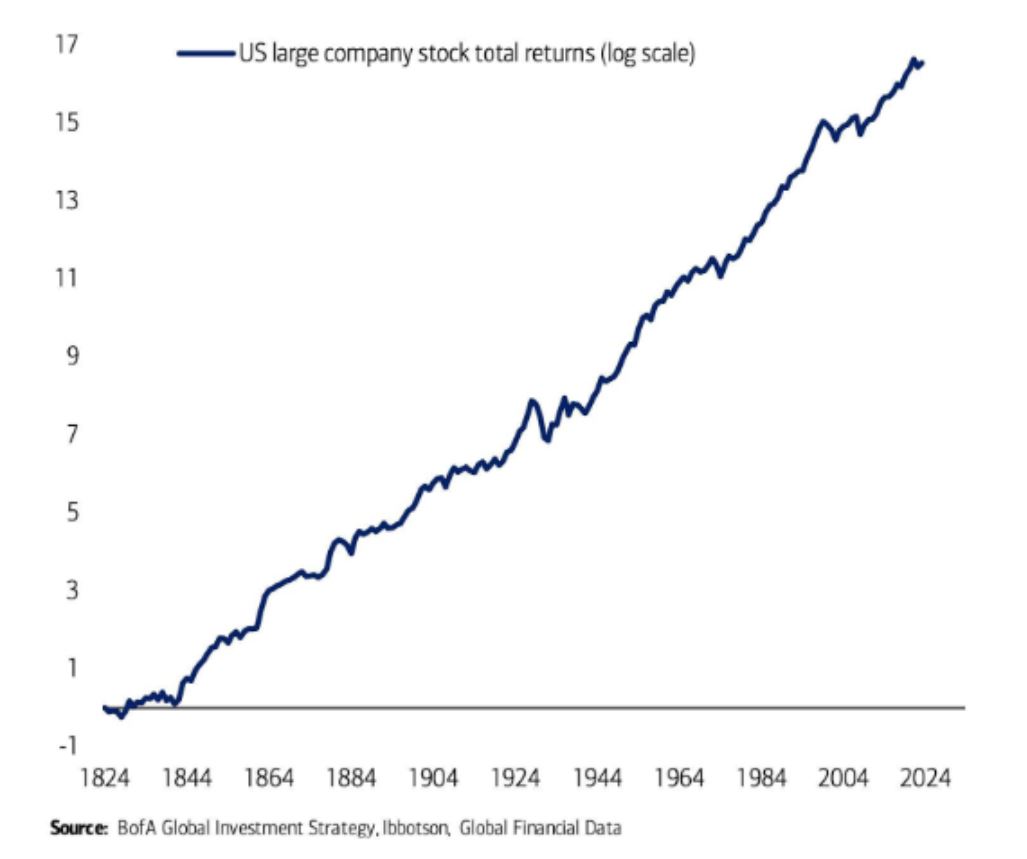
FYI: For those who worry too much, this chart shows a 200 year history of the stock market:
.
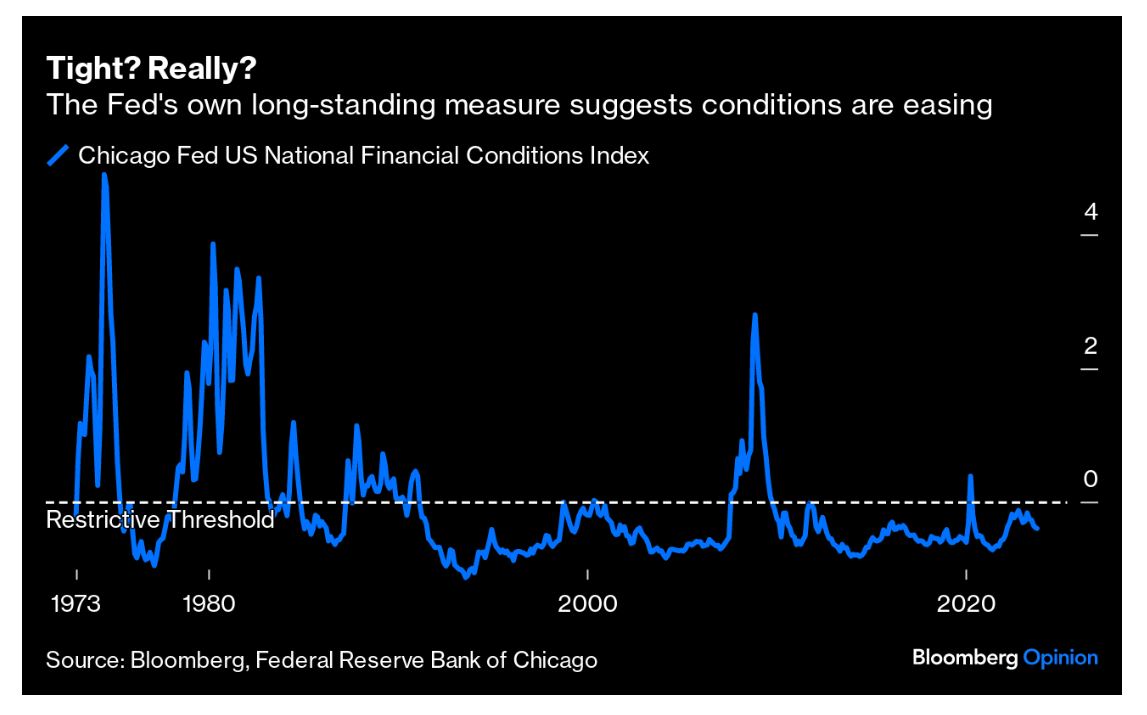
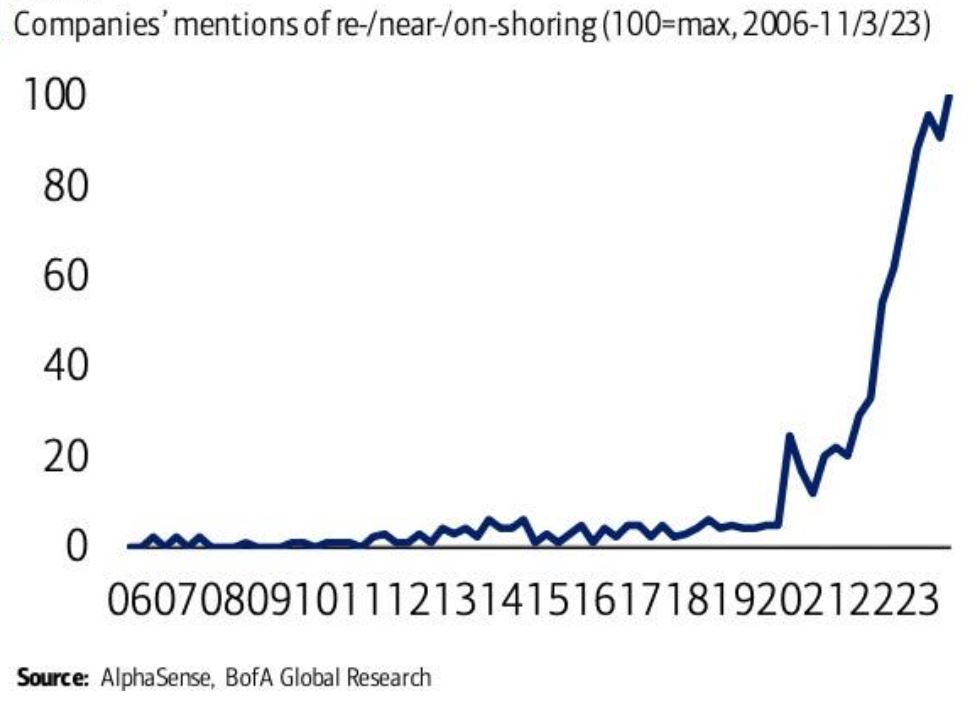
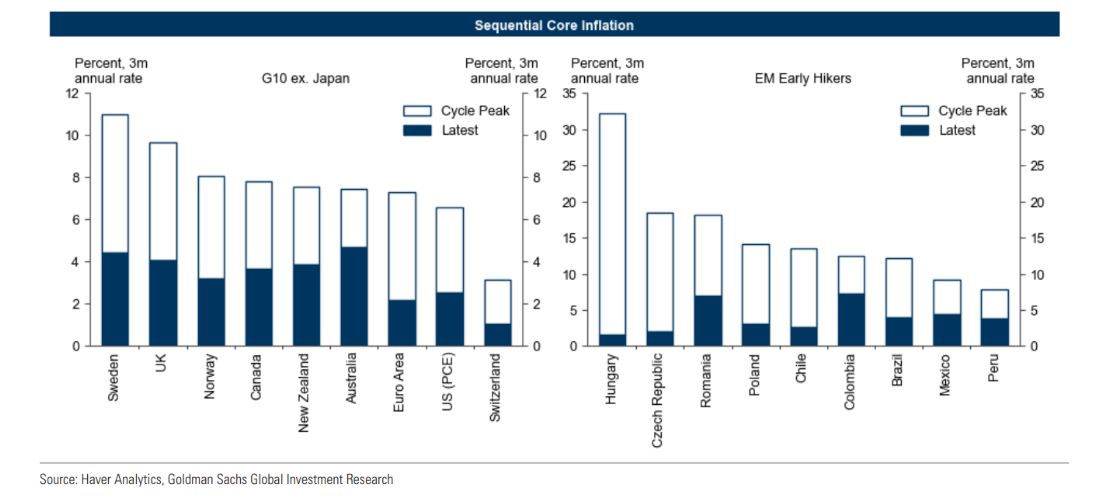
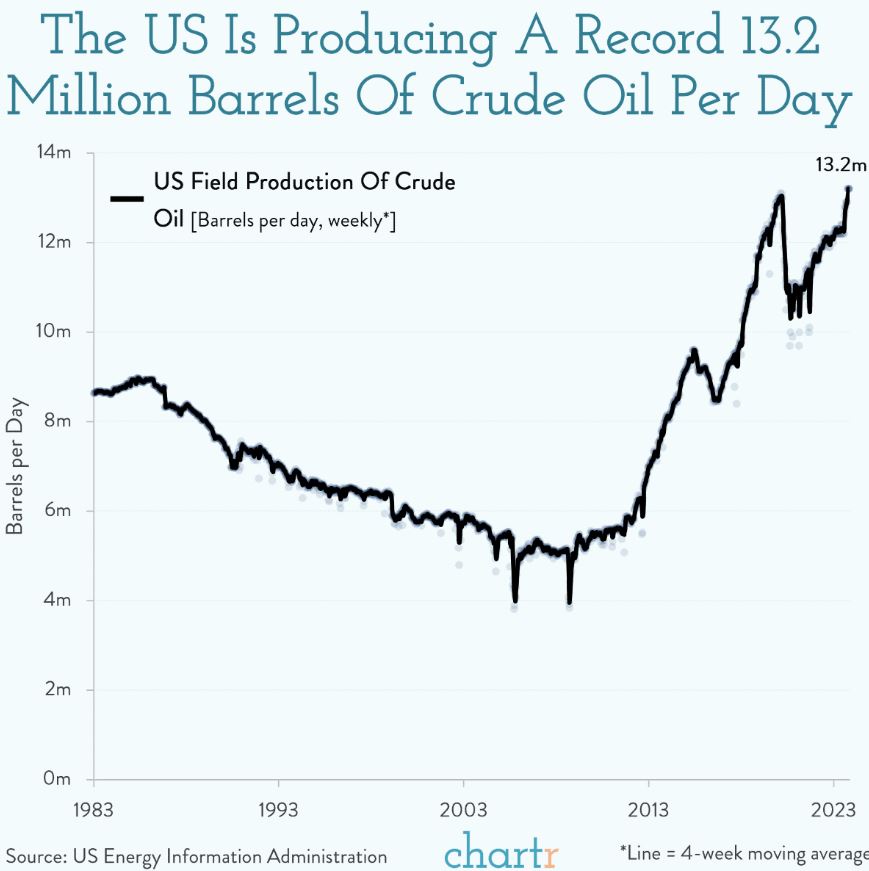
FOUR CHARTS showing bullish tailwinds:
This first chart shows that the U.S. Fed is nowhere near as restrictive as people believe. (Chart courtesy of the Federal Reserve):
.
Manufacturing is re-shoring back to the United States from abroad. That next item that you buy just might be made in the United States. Re-shoring comments presented during U.S. corporate earnings season revealed something important… see the rising line on the right hand side of this chart. I’ve repeatedly stated that the United States would lead in relative strength until some time around 2029. (Chart courtesy of AlphaSense):
.
Sequential core inflation has declined substantially everywhere. The U.S. and the Euro area have now fallen to below 3%. Over a year ago MarketCycle predicted that inflation would eventually settle, after a rough bottoming process, at around 3%, which would be both easy to live with and very bullish for investment assets. (Chart courtesy of Haver Analytics & Goldman Sachs):
.
Strong current U.S. oil production and a growing interest in creating alternative energy manufacturing in the U.S. are powerful tailwinds for U.S. stocks. (Chart courtesy of the U.S. Department of Energy):
.
.
IMPORTANT: Below is MarketCycle’s selection of strongest current asset choices using our NEW proprietary asset selection system which we’ve re-worked & re-developed & continually tested over the past 4 years… and very recently implemented. We now (daily) run over 100 global assets through a very tough gauntlet to see which few can survive under current conditions and over multiple timeframes. We did this because of the new extreme level of chaos created by big-money computerized trading programs (“garbage in; garbage out”) and by millions of un-educated retail investors using phone apps to jump in and out of the market simply because someone told them to do so.
So, all of our chosen assets continue to be U.S. based and held in USDollars and our actual picks are paying outsized interest & dividends (half of our portfolio allocation is paying between 10%-65%), yet most of our portfolio assets are held in a manner that reduces risk.
Here are the strongest current positions:
- Master-Limited-Partnerships
- large-cap home builder stocks
- large-cap momuntum stocks
- large-cap quality stocks
- Nasdaq-100 stocks (this is mostly large-cap technology and consumer-discretionary)
- there is only one small-cap ETF beating the S&P-500 (yes, we’ve held it all year)
- there is only one low-volatilty ETF beating the S&P-500 (and yes, we’ve held it for years now)
- strongest sectors: technology and consumer-discretionary with financials and industrials attempting to catch up
- gold bullion is strong and I expect it to become very strong over the longer-term
- just now starting to move higher and with great potential strength: high-quality corporate bonds and Treasury bonds of long-duration
.
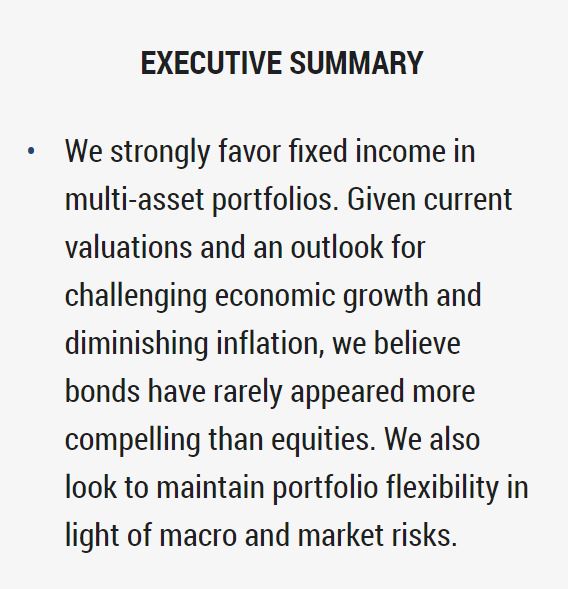
PIMCO’s 2024 forecast, they suggest buying long-duration quality corporate and Treasury bonds in the United States. “Long duration” means the 20-30 year bond rather than short dated bonds (and they are still bullish on U.S. stocks). Goldman Sachs also just released their 2024 suggestion posting and stated the same.
.
Which assets are currently severely oversold and should be watched for eventual signs of life?
- small-cap stocks
- eaual-weighted stock indexes
- mid-sized technology stocks
- REITs (Real estate Investment Trusts)… Renaissance Macro turned bullish on REITS in late November
- sectors of: innovative technology and alternative energy
- adding to high-quality bonds, preferred shares and convertible bonds
.
SUMMARY: 
Thanks for reading!
MarketCycle’s primary function is to manage investment accounts, but we do also offer complimentary advice to anyone at any time. Yes, we offer free advice. There is a contact tab at the top of our website and we will respond on the same day.
Our paid member’s REPORT site can be reached via the link on this website.
Client accounts can be reached via the connecting link on this website.
.

.
MARKET CYCLE — TREND FOLLOWING — SECTOR FACTOR — DUAL MOMENTUM — HEDGE FUND
.

