MarketCycle Wealth Management developed one of the very first Relative Strength Analysis programs way back in the very early 1980’s and it is still in use globally today. But because of major changes in the modern day workings of the markets (causing professional investors to NO LONGER BEAT the market), MarketCycle spent four years in developing a new and innovative asset selection system… lots of hard work and a few big (and lucky) epiphanies along the way.
Because of this major change and the fact that it totally alters what we are doing, we are starting over with our Performance Chart as of the date of first officially implementing this new asset selection system on October 27, 2023. The chart below will be updated quarterly, by the first week of January, April, July and October.
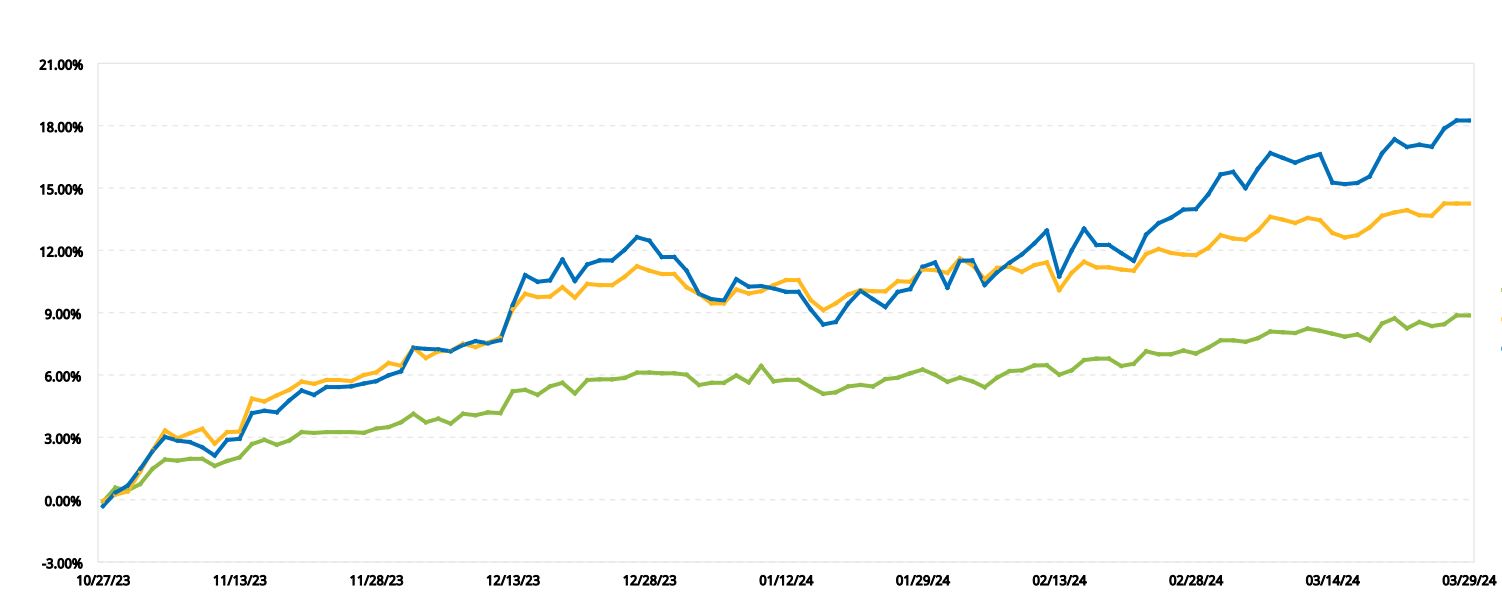
Our goal is to see the line moving from the lower left to the upper right, signifying the path to profits. Where the gap between the two profit lines below widens, in early December, is where MarketCycle finally fully implemented our new assets per our new method.
.
THE HEDGE FUND INDEX shown via the green line below… shown with NO fees extracted plus weak & closed fund results removed from the index, leaving only the winners.
80/20 PORTFOLIO shown in gold… 100% invested as follows: 40% S&P-500 & 40% Nasdaq-100 plus 10% corporate bonds & 10% Treasury-bonds… this is a tough mix to beat, but we did. Shown with NO fees extracted.
MARKETCYCLE PORTFOLIO shown in blue… shown below with all fees already extracted and before additional (large) quarterly interest and dividends were added to our performance… plus our (fully funded and trading in real time) portfolio holds less risk than does the Hedge Fund Index or the S&P-500
.