MarketCycle Wealth Management
Up, Up, and Away!

There are seven things that always happen at major stock market bottoms going back as far as 72 years (some of these can only be tested back to 1950). All seven triggered in mid-June.
MarketCycle’s proprietary indicators are shouting in unison: “Up, up, and away!” It is not logical to remain bearish upon seeing obvious bullishness. If these signals flip back to bearish, which would be highly unusual at this point, then we will simply change our position (which is also logical). But right now MarketCycle is fully bullish, although we’re using a barbell approach of defensive stock sectors & factors that are balanced out with early-cycle aggressive assets.
It is quite possible that a recession will still be called, although it would likely be a fairly insignificant recession, one in name only, a “technical” recession, a “profits” recession, a “growth” recession. But not a “real” recession. Maybe the powers that be will state that we have already been in a recession and then everyone will say in unison: “Oh yes, I knew that.” When the Federal Reserve raised interest rates on Wednesday (July 27th) by a whopping 0.75%, the only part of the yield curve that counts (the 3-month-yield to the 10-year-yield) not only did NOT finally invert, but it actually got steeper. The most important signal of a coming recession got more bullish, contrary to what should have happened. And two back to back quarters of negative Gross Domestic Product (GDP) do not a recession make. Meanwhile, so far 70% of corporations have beaten their quarterly earnings estimates, employment is still super-strong, the consumer is still steadily spending and insiders are still buying shares of their own corporations… at a record pace.
Since stocks move about 6-12 months ahead of a recession, if a recession does eventually occur, it may not be noticed at all by the stock market when/if it arrives. Right now the stock market is focusing on 2023 and it has already priced in most of the events that could or will occur during the second half of 2022, including rate increases, recession, war, Covid, Monkey Pox, Cooties and the fact that a large swath of the globe is literally on fire right now. The economy moves in real time but stocks move way ahead of the economy; this is why stocks dropped six months before anyone even considered that a recession was a possibility.
And we have to remember that stock prices actually reflect the strength of the underlying corporations, so stocks, over longer expanses of time, are distinct and separate from the economy. “News” only affects stocks for short periods of days to weeks. So, by December of 2021, stock prices had gotten ahead of the actual strength of the corporations and they had to come back down to earth… thus, the recent bear market. Stocks are now fairly priced and we even experienced a capitulation bottom in mid-June… thus, the next bull market.
In mid-June we had an actual capitulation that went totally unnoticed; everyone threw in the towel and gave up hope. Most traders deny that we had a capitulation… almost all traders are still waiting for the VIX (volatility index) to move above 40, but if one were to look at a long term chart of the VIX, it is quite clear that “40” is a totally meaningless and random number. Bull markets, like the Phoenix, rise out of the ashes of a burned down stock market and the market has already burned down. A number of things give evidence to this and a few are shown below.
The record move from stocks to cash is (contrarian) bullish. (Chart courtesy of Bloomberg)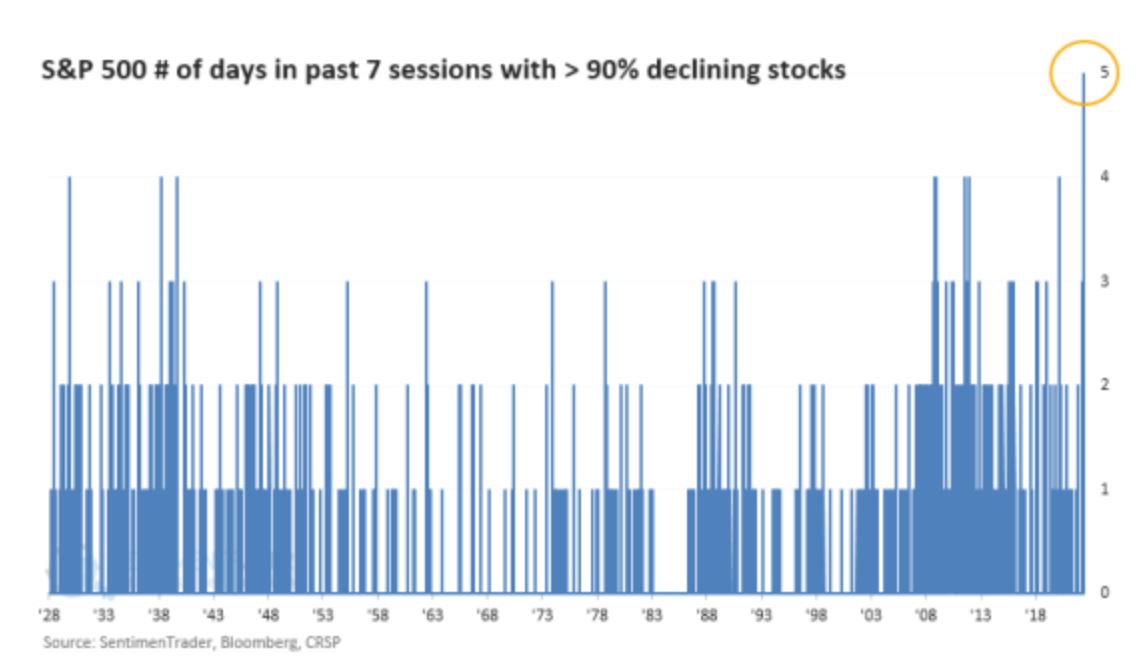
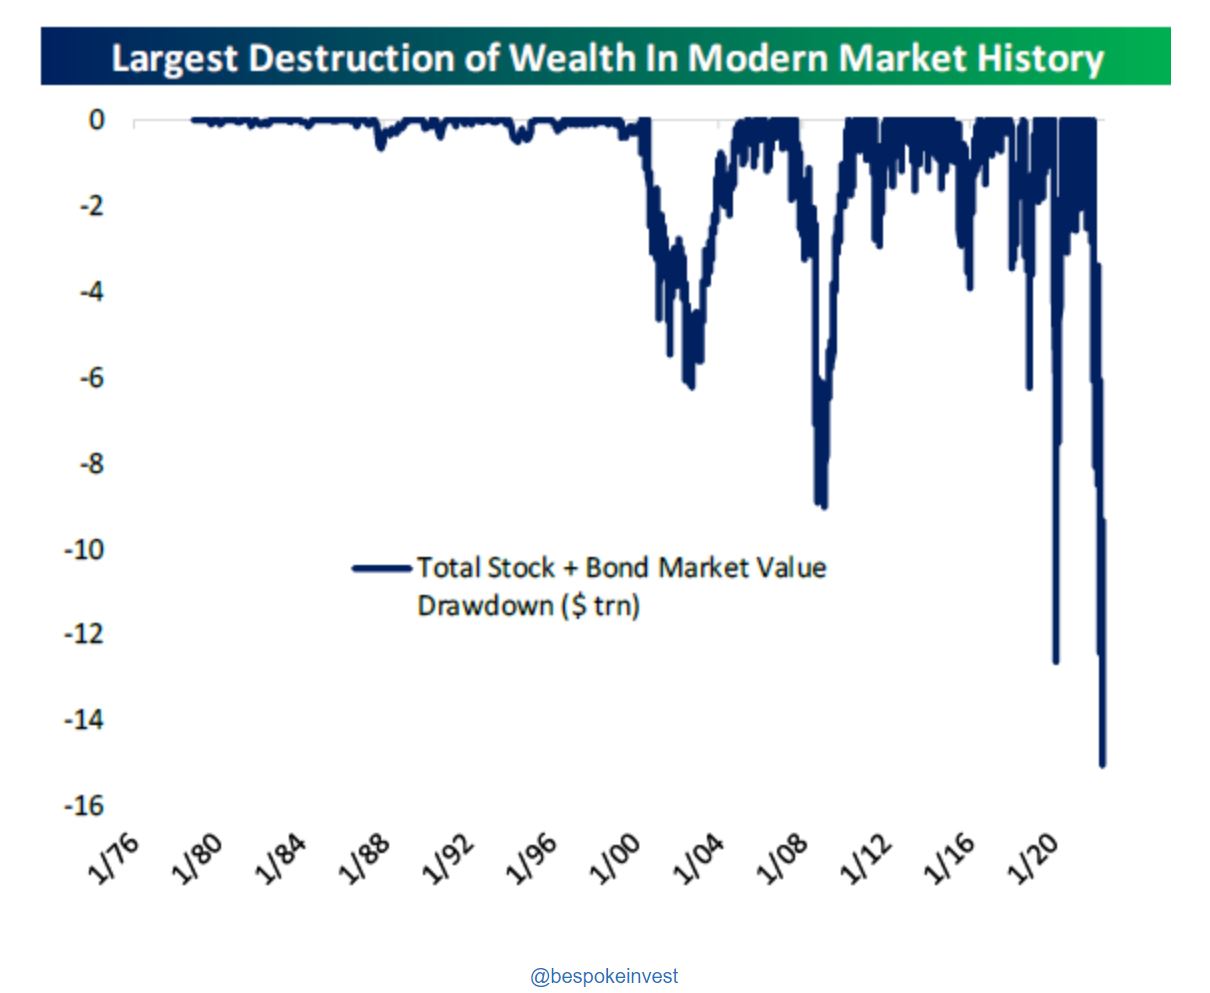
Massive wealth destruction (because both stocks and bonds sold off at the same time, which is exceedingly rare) is actually bullish because valuations have been completely reset. Stocks are now worth more than their current asking price. (Chart courtesy of Bespoke Research)
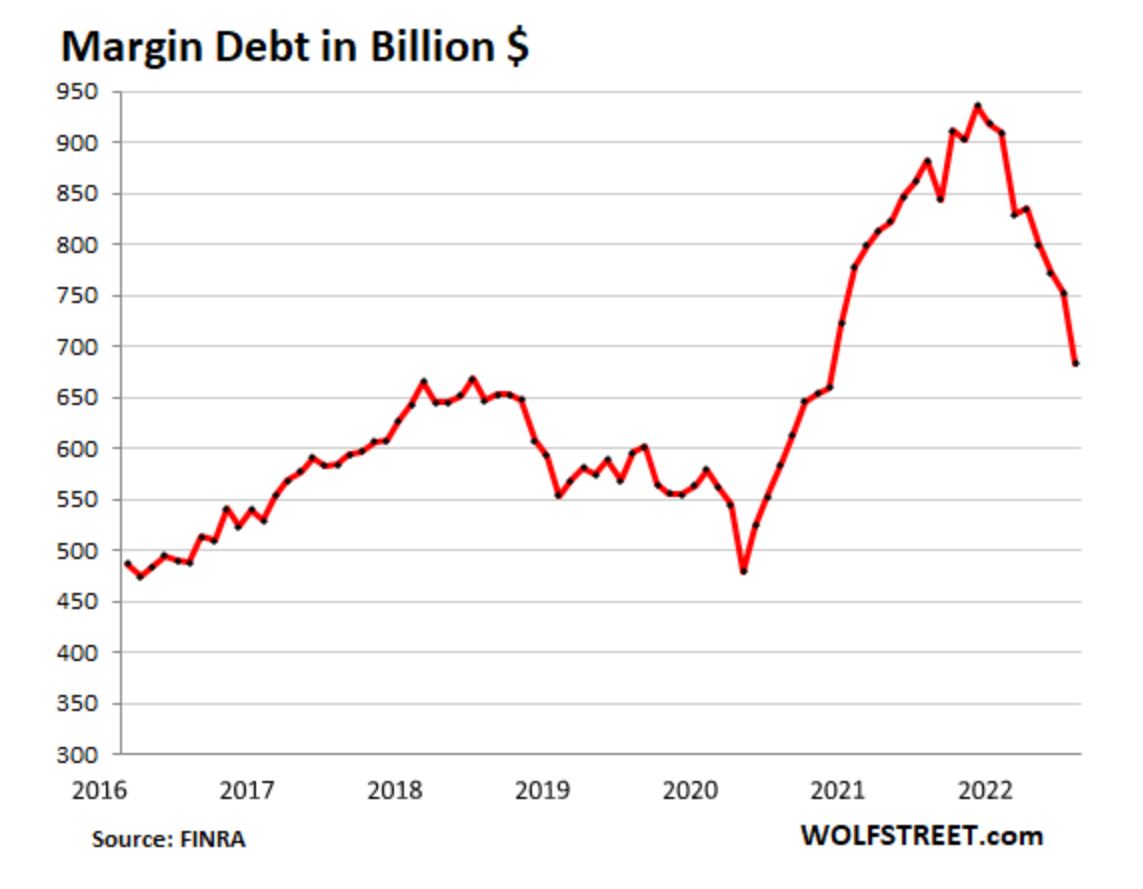
Margin debt, money borrowed for investment purposes, has been voluntarily surrendered… it is usually via a forced liquidation but this time it was (smartly) purely voluntary on the part of hedge funds and big institutions like Goldman Sachs. This eliminates the need for the usual and falsely expected final leg down for the stock market. (Chart courtesy of WolfStreet)
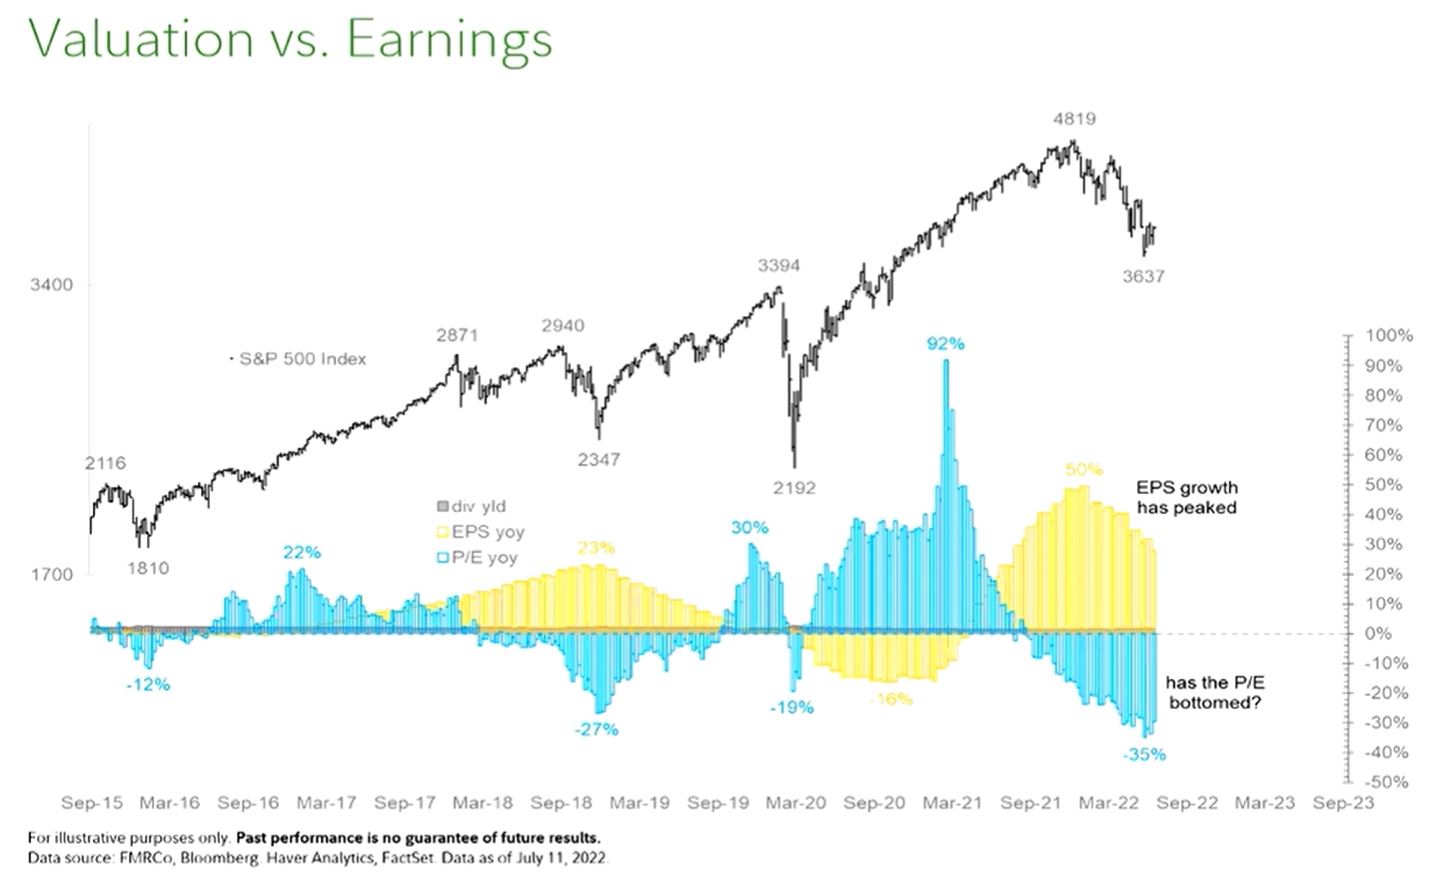
Corporate earnings have likely bottomed or are very close to bottoming. Stocks are now cheap. (Chart courtesy of Haver Analytics)
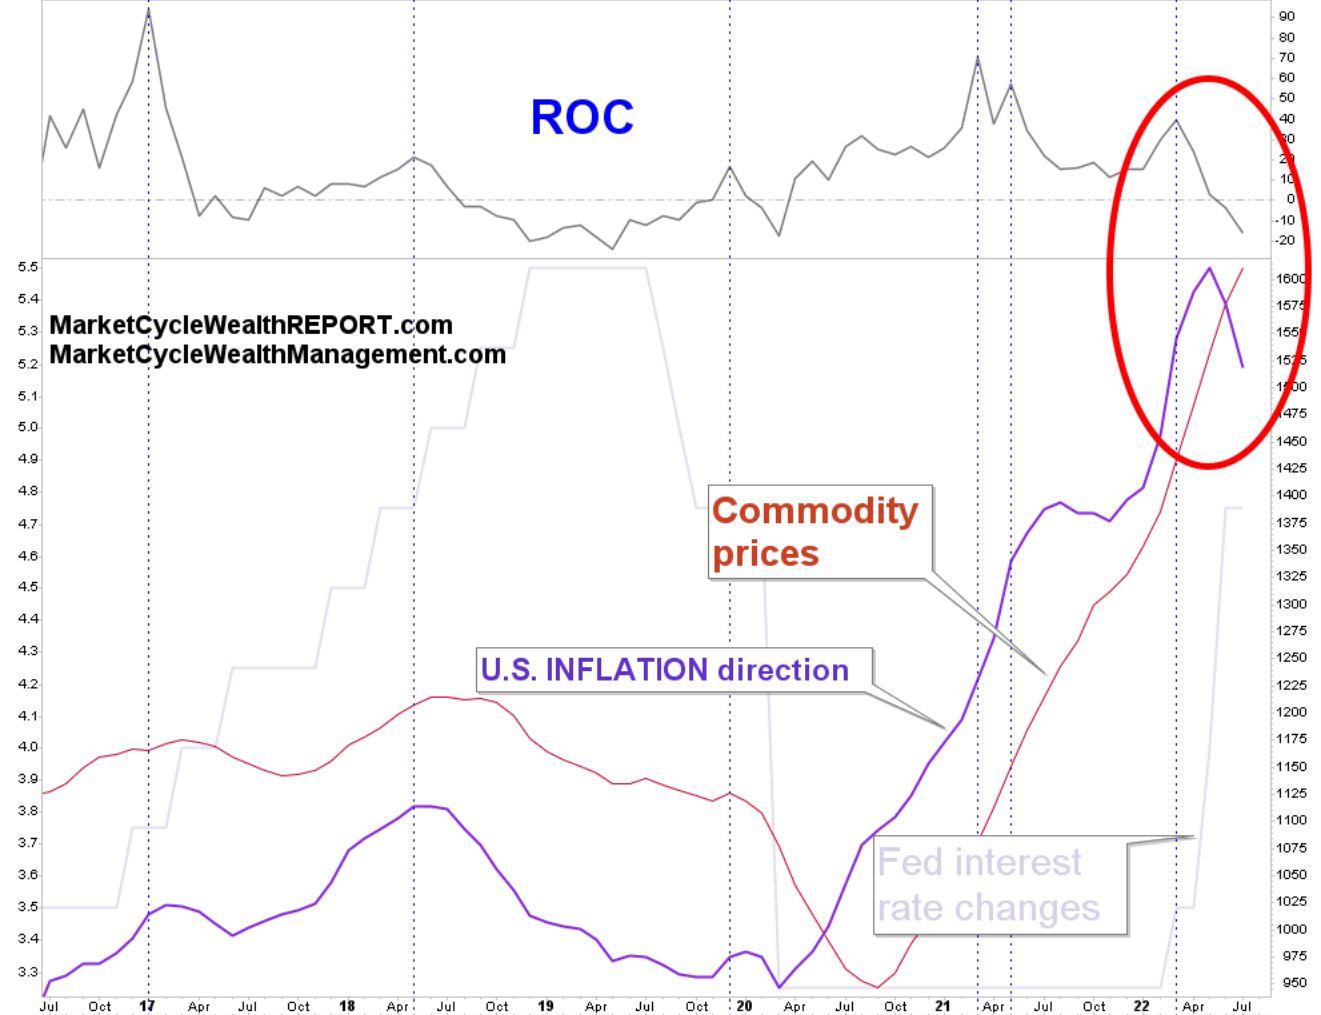
Inflation has likely peaked, as MarketCycle first stated several months ago. We were one of the first to see inflation rising (back in early April of 2020) and one of the first to see it peaking and heading lower. In the bold red circle below, the purple line is accelerated inflation data, now moving down, and the higher grey line is an accelerated rate-of-change of the purple line, which gives an even earlier signal. (MarketCycle chart)
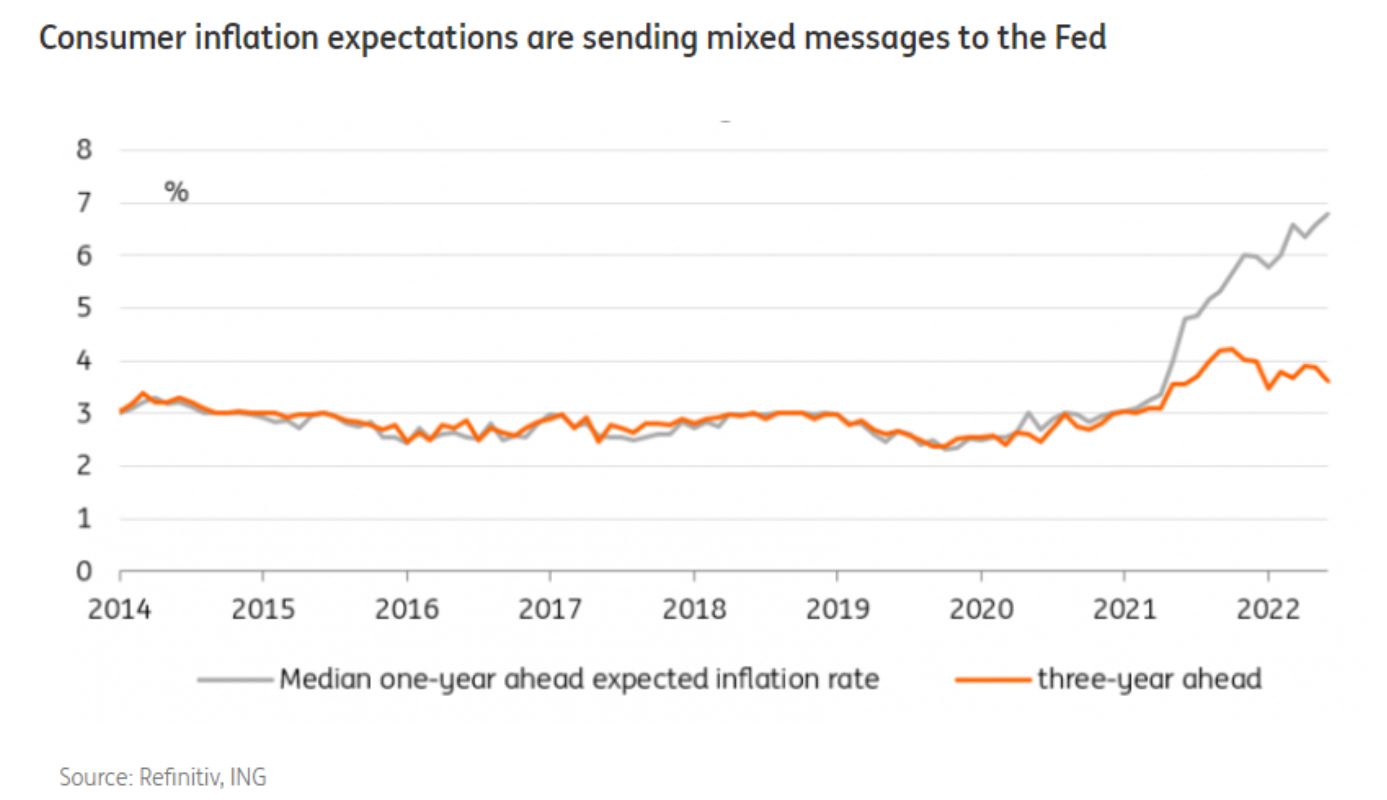
This next chart does not show inflation peaking, yet, but it does show expections for inflation to soon settle at 3-4%, exactly as MarketCycle stated some months back. (Chart courtesy of ING)
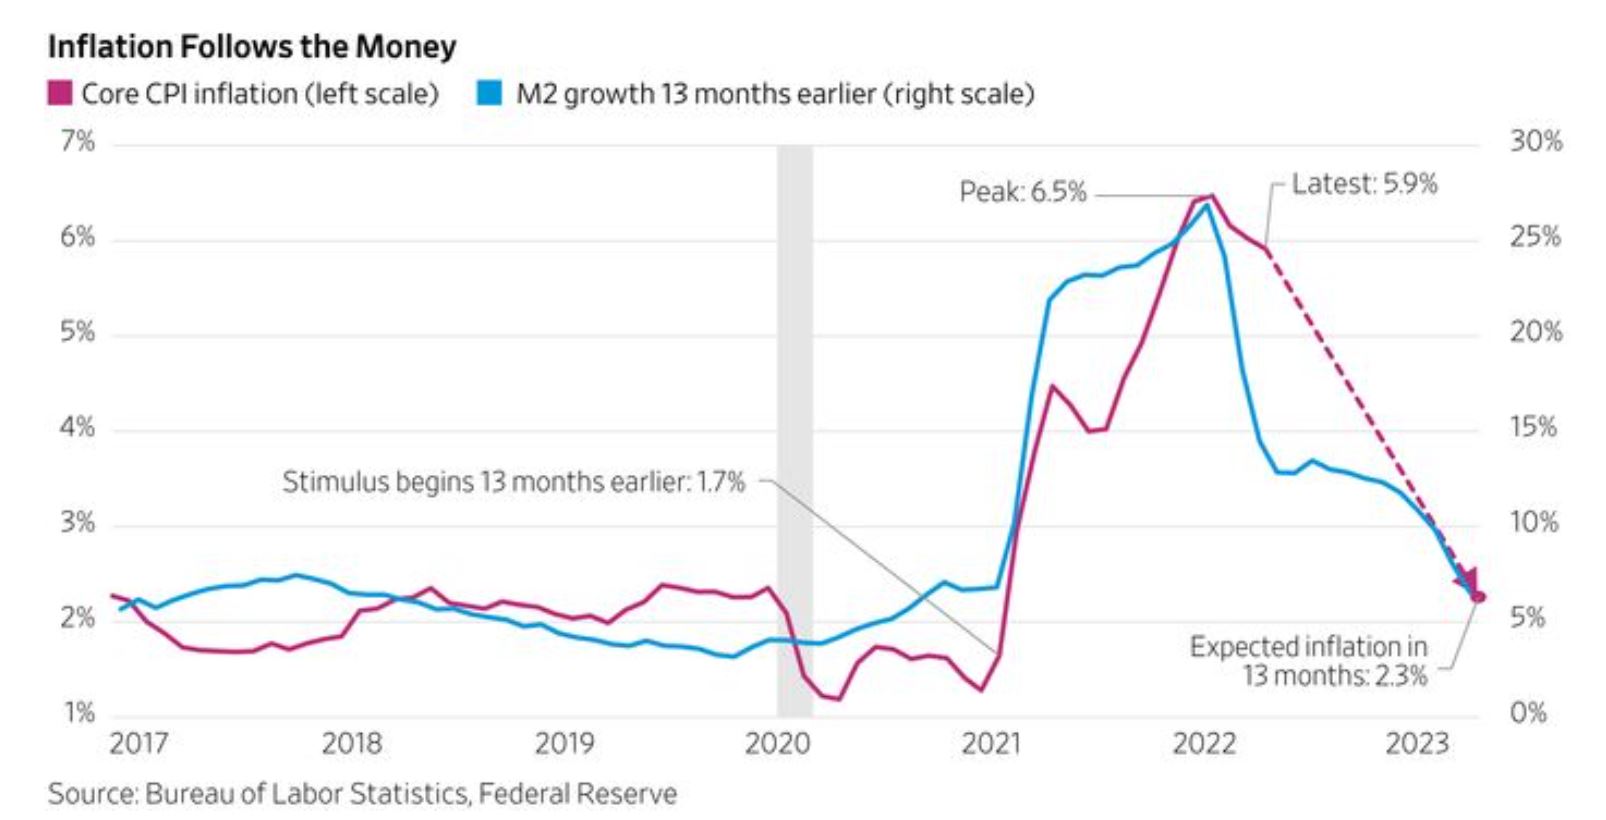
Inflation levels follow Fed ‘money creation or removal.’ This chart from the Federal Reserve (and their massive research department) suggests that inflation will be at 2.3% by this time next year (my estimate is 3.3%). Why do I seem to concentrate on U.S. data? Because the United States has lead in relative strength since October of 2011. This will all change in the 2030’s, but right now, as goes the United States economy, so goes the rest of the world. But the inverse does not hold; when the globe is economically weak, it has little affect on the economy of the United States.
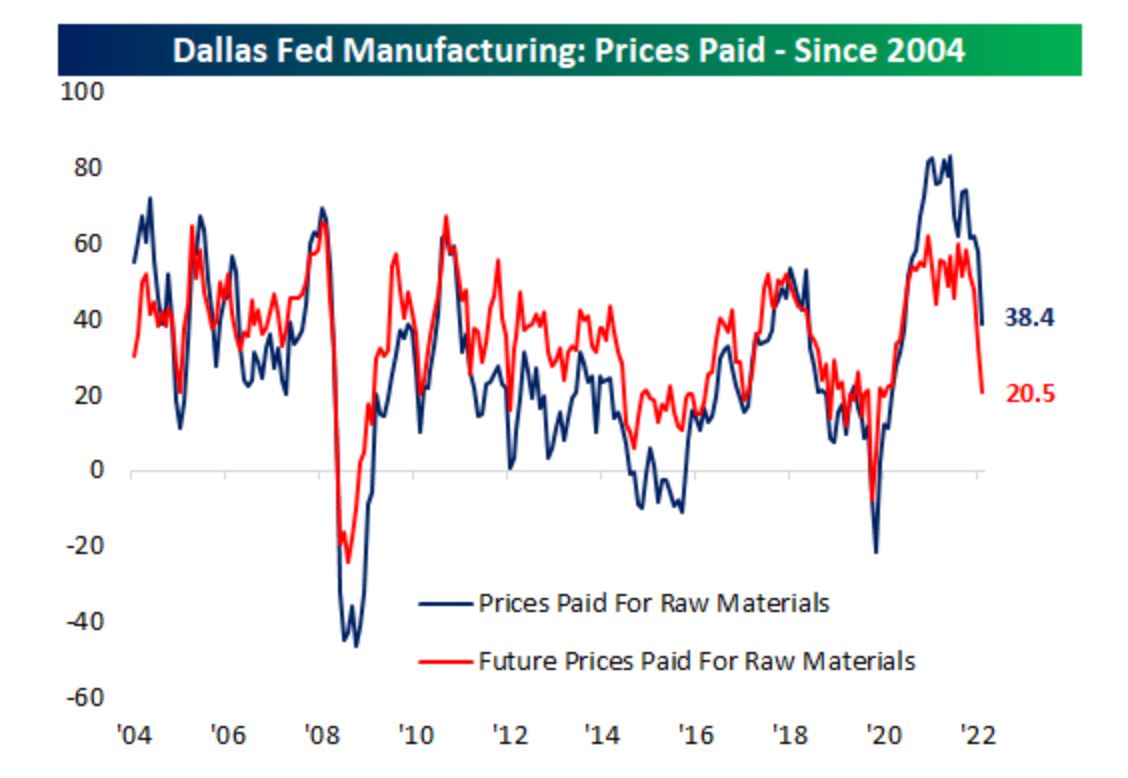
This chart from the Federal Reserve shows that “prices paid” by manufacturers is dropping fast (far right on the chart)… this means that inflation is dropping fast even though most economic data does not yet show it. Inflation is the thing that hurt the stock market for the first 6 months of 2022. No or low inflation = good for stocks.
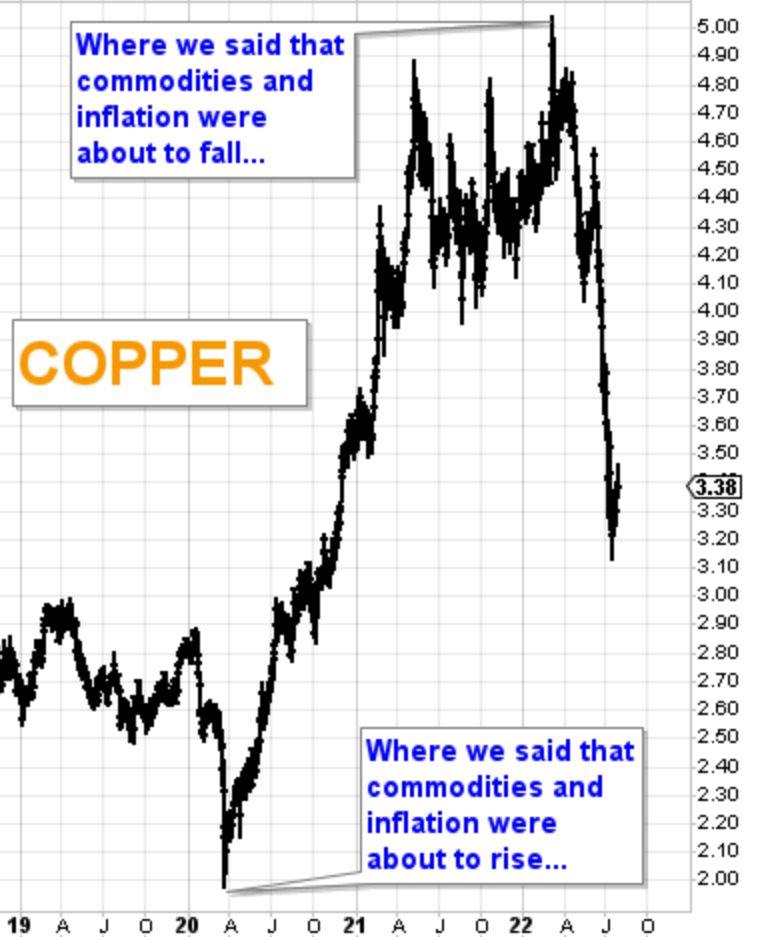
Inflation is when the things that you buy cost you more. Items cost more because the price of the commodities out of which they are made has gone up. The commodity that gives the clearest image of what is happening with all commodities is copper, also known as “Dr. Copper” because of its ability to diagnose. This next chart shows the price of copper and it also shows the two times that we gave predictions (in this blog) on the future prices of commodities and inflation. There couldn’t be a clearer image of the fact that commodities (and house prices) are falling (right side black line, straight down like a knife cut), copper having fallen from 5.15 to 3.38… a 40% price drop in just 4 months. (MarketCycle chart)
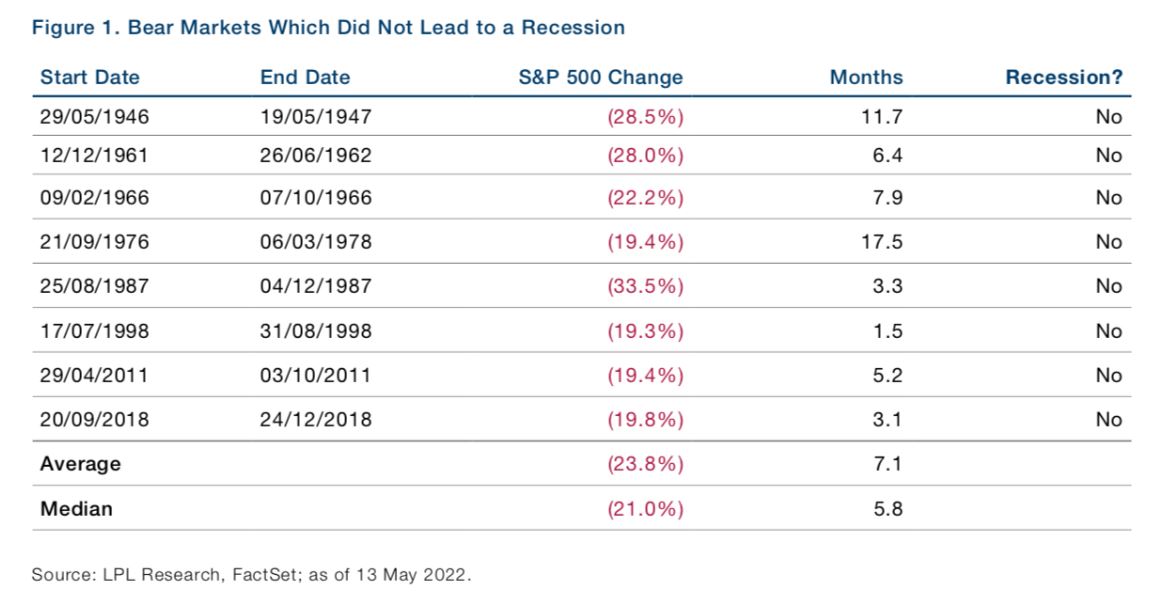
This next chart shows bear markets that did not lead to a real economic recession. Some recessions are in name only… so called “growth recessions” which are actually slow growth periods rather than deflationary & recessionary periods. If an official recession is called, it may not mean that much this time around. (Chart courtesy of LPL Research)
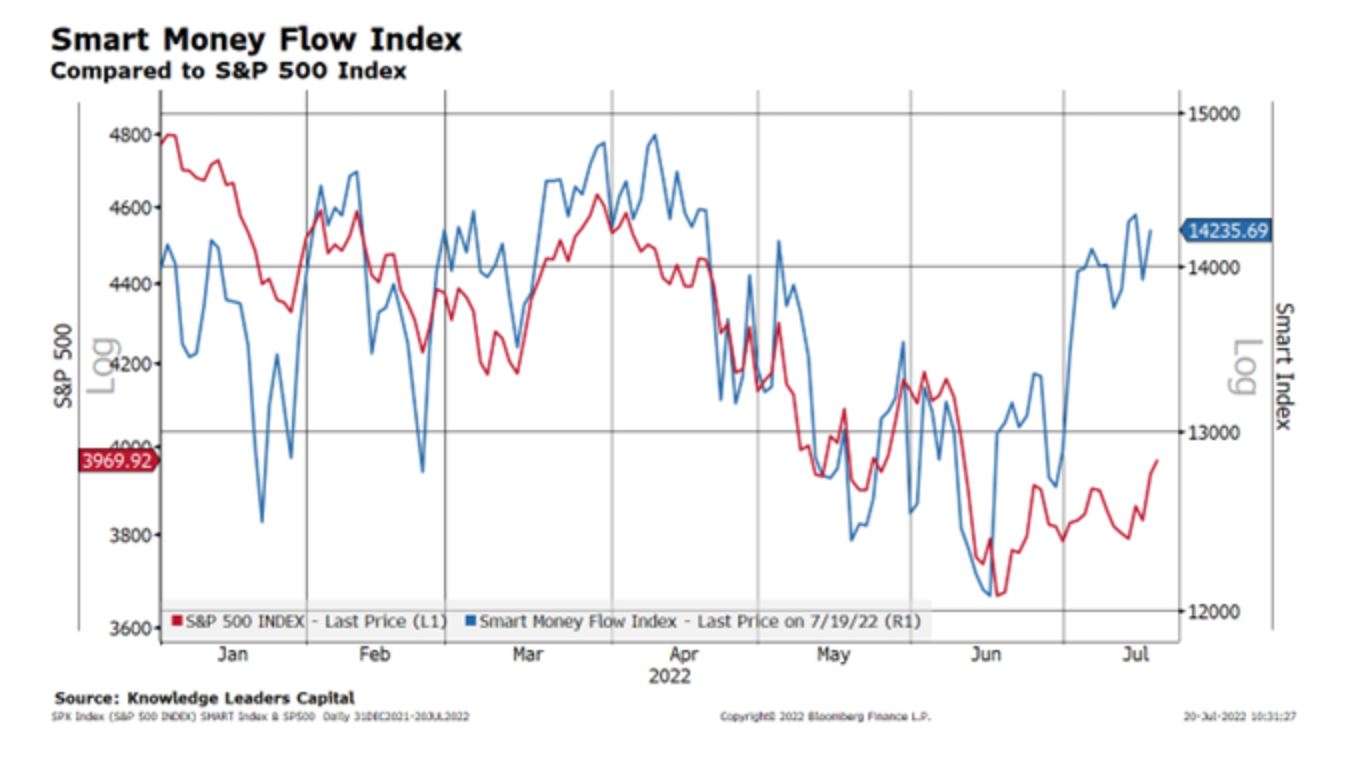
Smart money… the red line below is the S&P-500 and it always eventually follows the (blue line) smart money, which is now very bullish even as the retail investor is still cowering. People have a mental tendency to project what is happening today into the future, falsely believing that what is happening today (bear market) will continue indefinitely. But real experience teaches us that stocks are going to go back up and then on to new record highs. (Chart courtesy of Bloomberg and Knowledge Leaders Research)
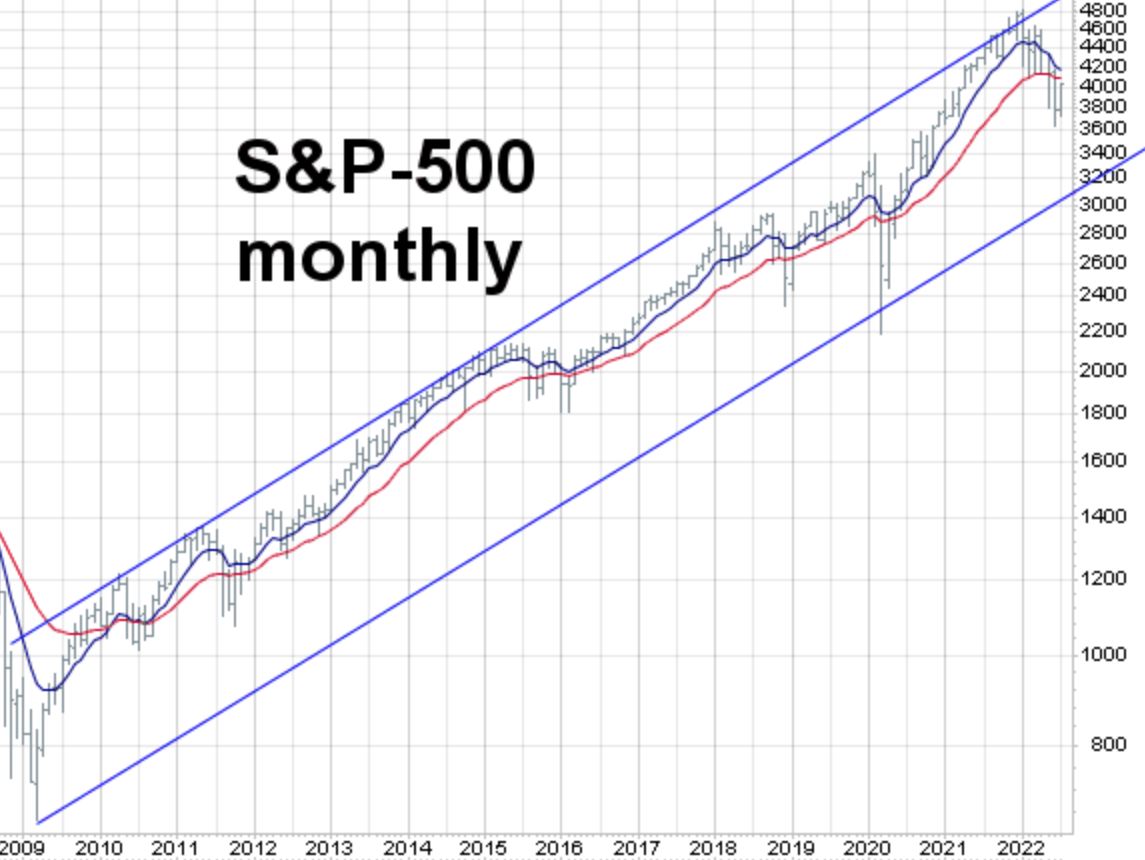
Note on the chart below how the stock market always zig-zags on its way both up and down, even though, over time, it moves in a general trend direction for extended periods that can last for as much as two decades. I don’t expect the trend channel (formed by the two blue lines) to end until sometime around 2029. (MarketCycle chart)
Ed Yardeni, just another in a number of well known (for a reason) high cost analysts suggesting that the bottom is already in and that a new cyclical stock bull market has started. (Bloomberg headline)

MarketCycle has already seen our 7 bottoming indicators all trigger and our many bull market indicators move to bullish. If we are wrong, and I don’t currently believe that we are, then we will be willing to switch our positioning to reflect the change. We have to remember that the stock market moves 6-12 months ahead of what you are currently seeing in the news. When you start to believe that a recession is coming, the stock market has already priced that into the market many months prior. When you are at your worst emotional point, the market is already looking ahead by 6-12 months and it doesn’t care about your opinion.
For the record, most of Wall Street disagrees with my current assessment, but I generally find this to be a normal occurrence when the market is at an extreme. Right now, all of those assets and sectors that would normally lead at the beginning of a new cyclical bull market are now fully leading the way up even on “bad news days.” Assets and sectors that always lead at the end of a bull market are falling fast. And assets that perform well during recessions are also now rapidly weakening. Everything is lining up and rotating the way that it should be if we were moving into a brand new CYCLICAL stock bull market even while the overlapping and super-strong SECULAR stock bull market remains fully intact. You will eventually see the S&P-500 @ 10,000. So, perhaps it really is “up, up, and away!”

Thanks for reading!
MarketCycle Wealth Management is in the business of navigating YOUR investment account through rough waters. Professional management can pay for itself. It is simple and easy and affordable. And our personal investment accounts are positioned exactly like our clients, so you better know that we’re constantly & continually on top of things.
REPORT website… there is a link to our second website via this website.
