MARKETCYCLE WEALTH MANAGEMENT
Finding a Bottom

It is my responsibility to identify high risk periods that may signal a market top and to also identify then reduced risk periods that may signal a good bargain-buying opportunity. You cannot time the market tops and bottoms, but you can quantify risk levels and decide if it is time to wait things out until perceived risk levels once again abate. They are almost the same things. Most times this process is fairly clean as in 2000 and 2008 and 2015 and 2018 and even 2020. Sometimes it is all a bit jumbled & confused as in 2022. At least I was a bit confused.
MarketCycle identified higher than normal risk levels in very late 2021. We eventually felt that a bottom would be made at around 3815-3800. This support area tried desperately to hold, but ultimately failed to offer strong enough support because of renewed rising inflation data that was being caused by sanctions around the Ukraine War. We now feel that the market will likely bottom with the S&P-500 @ 3500-3400. At 3500, the market will have pre-priced in just about anything bad that could possibly happen, including a recession; the market always prices in events before they happen because it is forward looking by many months. Right now it is pre-pricing in what it expects to be happening to the economy in late 2022 or even very early 2023; it will soon be pricing in what it expects to occur after that time period. Stocks and the economy definitely do not move in unison, as many people mistakenly believe. Stocks move many months before the economy, in both directions.
So, we have had a fairly troubling but temporary downturn; the prolonged duration of the event makes it seem worse than it actually is. Right now it is just a typical downturn in percentage losses. It is definitely less than what temporarily happened in 2020 with the covid shutdown.
Even though I now expect the stock market to eventually head down to the S&P-500 @ 3500-3400 area, the stock market is currently oversold and it is due a bounce. This bounce, if it manifests here and now, may last for one week or multiple weeks. Counter-trend rallies always happen in bear markets (usually 3 times), but then the market heads lower again (until it finds its bottom).
In the unlikely and unexpected event that S&P-500 @ 3500-3400 does not hold, in a “worst case & world ending scenario,” where might the final bottom area be found? S&P-500 @ 3200… not too far below the above suggested bottoming area. But if it were to hit here, the market might move higher again at such a rapid speed that it would almost be remembered as some sort of dream-like non-event.
When looking over MarketCycle’s array of indicators this weekend, I could see that we might get & need a bounce, here or soon, in order to somewhat later bottom officially and correctly. There are two price gaps on the price chart of the S&P-500 and these have to be back-filled. I would be a bit surprised to see both gaps back-filled during a market bounce.
This bear market has been caused because of rising inflation levels. What would cause the 18 year Secular stock bull market to continue higher? The elimination of too high inflation. MarketCycle’s indicators are now saying that inflation has recently peaked and that if it stabilizes here, then it will fall, and if it falls, then the stock market will love it. And when China reopens its economy, which can’t be too far away (their next planned national meeting is in October), then this would also give a big bullish infusion to the markets.
Both of the price gaps (purple arrows) and both of the strong bottom support areas (purple dashed lines that represent strong potential bottoming areas) are shown on this chart:
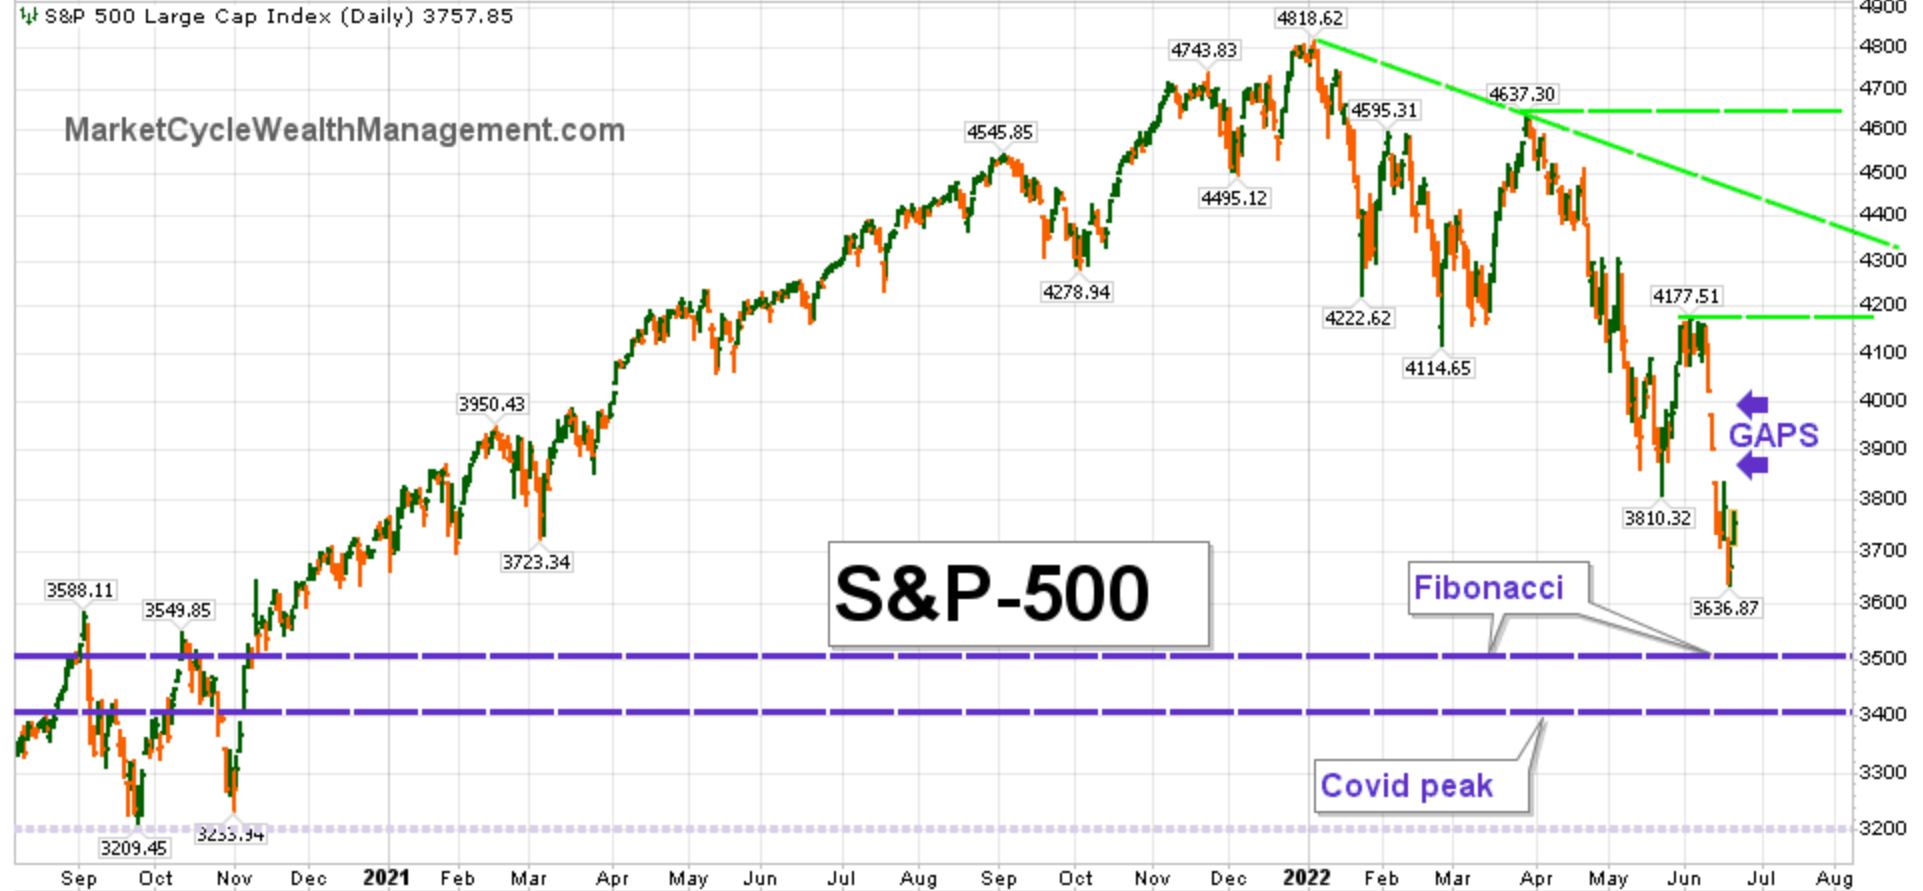
Ultimately and in the hindsight of looking in the rear-view mirror, the large rounded area on the chart above may look a bit like a big speed bump in the pathway of the continuing and profitable Secular stock bull market.
Thanks for reading!
MarketCycle Wealth Management is in the business of navigating your investment account through rough waters. It is simple, easy and affordable.