MarketCycle Wealth Management
My Answers to Experienced Client’s Questions

This article will be fairly brief and easy to understand by just taking it one sentence at a time. This is coming out right after another recent blog, but I’m sending this out because I’m about to go “quiet” for awhile.
MarketCycle has clients that are experienced traders/investors. We have a number of clients that work at or run hedge funds and we handle some of their personal money. These knowledgeable clients sometimes have questions, especially when we call either a market top or a market bottom. Frankly, some questions arise just because these very smart clients have too much information in their heads to allow for them to be able to see simpler answers. There is an old saying that sometimes “we can’t see the forest because of all of the trees.” So, my simpler brain is sometimes an asset.
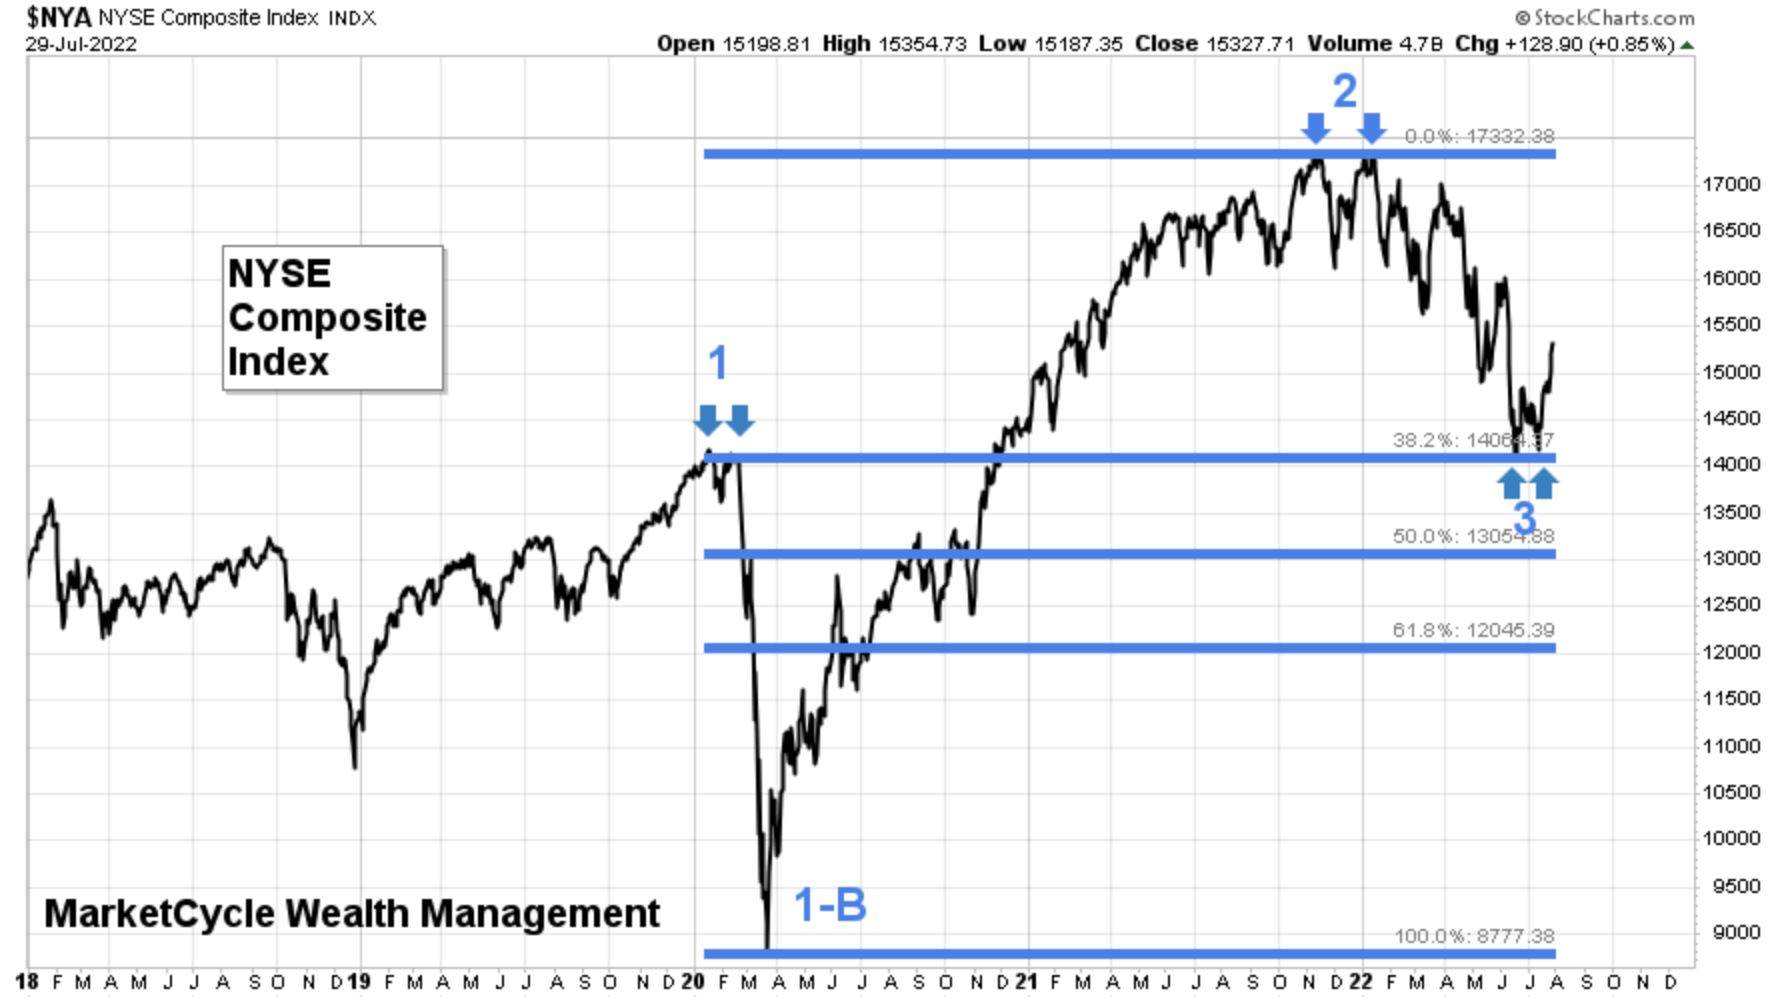
Note, this chart, which is also shown again below, will be used for the initial questions and answers:
These are some of the most common recent questions/comments (in bold) from these experienced people… and my responses:
- Will the U.S. stock market reach its Fibonacci sequence number? It already has, see the blue line @ #3 on the chart. We have described ‘Fibonacci’ in prior blogs or you could Google it. The only important thing about Fibonacci is that people believe in it and expect it to work and technical analysis people all react to it in unison… causing self-fulfilling prophecies.
- Will the stock market reach the strong support line represented by the top of the Covid correction? A support line is an area where the stock market is likely to be supported and not fall further. We have already reached and held at the major support line; see the blue line @ #3 on the chart.
- But won’t the stock market retest its June bottom? It already has, see #3 blue arrows on the chart… a perfect double bottom retest.
- In late December of 2021, what caused you to know that we were going into a high risk period? All of our risk indicators flipped to “caution” and market action implied “corrective bear market.” Less importantly, the stock market made a double top per #2 on the chart.
- During the first week of January 2022, you correctly moved to a high cash position but then you moved into normally safe Treasury-bonds, and these then lost money along with stocks, hurting performance. What happened? For my entire long lifetime, except for now, Treasury-bonds have gone up whenever stocks have gone down, but the game has now changed and a new solution had to be found, and it has now been found. Bonds will not react normally during much of the next 7-ish years. I grew up in Kentucky where there is a saying that “there is no lesson learned in the second kick of a horse.” This means that errors must be few and far between and that one must learn immediately and never repeat a situation, so that you don’t get kicked a second time. Truthfully, my predictions are very often correct, yet “often” is an important qualifier. [*** below…] With any problem that I either see or experience, you better know that I work non-stop to find a working solution.
- Doesn’t the VIX Volatility Index have to go above 40 for the bear market to officially bottom? The VIX is a measure of investor panic and resultant market volatility, all put into a visible chart format. If one were to look at a very long-term chart of the VIX, it is clear that “40” is a totally meaningless number, so no, the VIX absolutely does not have to go to 40. At this point, I do not see how it even could reach 40 without some rare & unexpected Black Swan event occuring out of nowhere.
- Don’t demographics (population statistics) show that the stock market will be weak going forward? No, it’s just the opposite. The only important part of U.S. demographics for investment accounts is the MY-Ratio, middle aged to young (MY). The section of the U.S. population that steadily funds investment accounts (driving markets higher) is extremely positive all the way through to 2029.
- What leads the market higher in any prior bull market normally never leads in any brand new bull market. Why is large-cap tech (FAANG) currently doing so well? FAANG is Facebook, Amazon, Apple, Netflix, Google. I feel that FAANG’s days of leading the market higher are over, however, FAANG recently sold off so much that it is sure to get an initial boost off of a market bottom. I do still feel that technology will lead; I just feel that it will be the rest of tech that will lead longer-term.
- Double tops, didn’t the Covid bear market make a double top too? Yes, see #1 on the chart.
- It didn’t make a double bottom but you called the bottom to the day. Markets don’t always show double tops or bottoms. Because the stock market fell so fast it was most likely to make a “V” shaped bottom as shown on #1-B… so we looked at our indicators that show whether the market had moved far enough down to constitute a highly probable opportunity for a bottom. At the time, we expoited this opportunity by loading up on Closed-End-Funds at a massive discount to net-asset-value.
- It doesn’t look as if the stock market has made its final big leg down and this is what still scares me? MARGIN is money that investors borrow from their brokerage house that they then use to bolster their investment account holdings. It is a dangerous activity that usually backfires at the worst possible time. Final legs down are always caused by margin being called back by the brokerage houses. ALWAYS. This time it will not need to be called back because it was pre-surrendered voluntarily (by hedge funds and institutions) as shown in our prior blog. This particular recent bear market really doesn’t need to pull-back any deeper than it already has. Fundamentals of the markets are quite strong so we are strong on both a technical and fundamental basis, yes we are, which means that the market could just keep climbing higher for the remainder of the year… and President Biden is about to release a type of monetary stimulus that is unlikely to cause a near-term inflation spike, unlike his Covid-checks, but this is likely to stimulate the U.S. markets for a prolonged period.

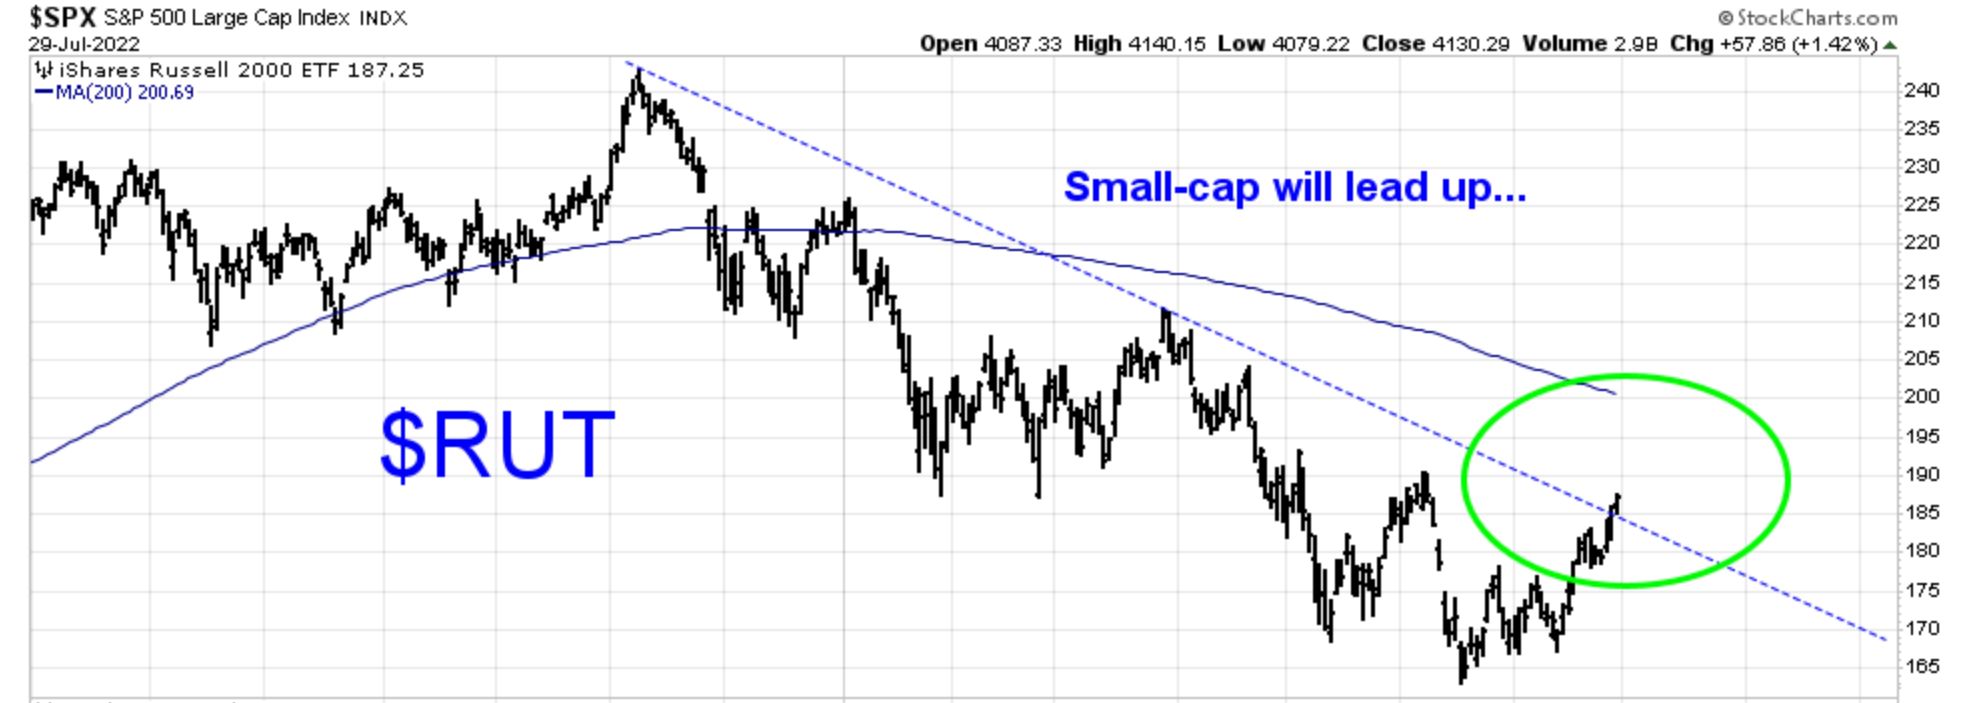
- Small-cap stocks normally lead the rest of the market up off of a bear market bottom… when will they break out to the upside? They already have broken above their important downward sloping bearish trendline (for the second day on Friday July 29th) as indicated in the green circle below; this is very bullish for stocks. Since small-caps lead, the rest of the stock market is likely to follow them up. But remember, all bull markets zig-zag on their way up.
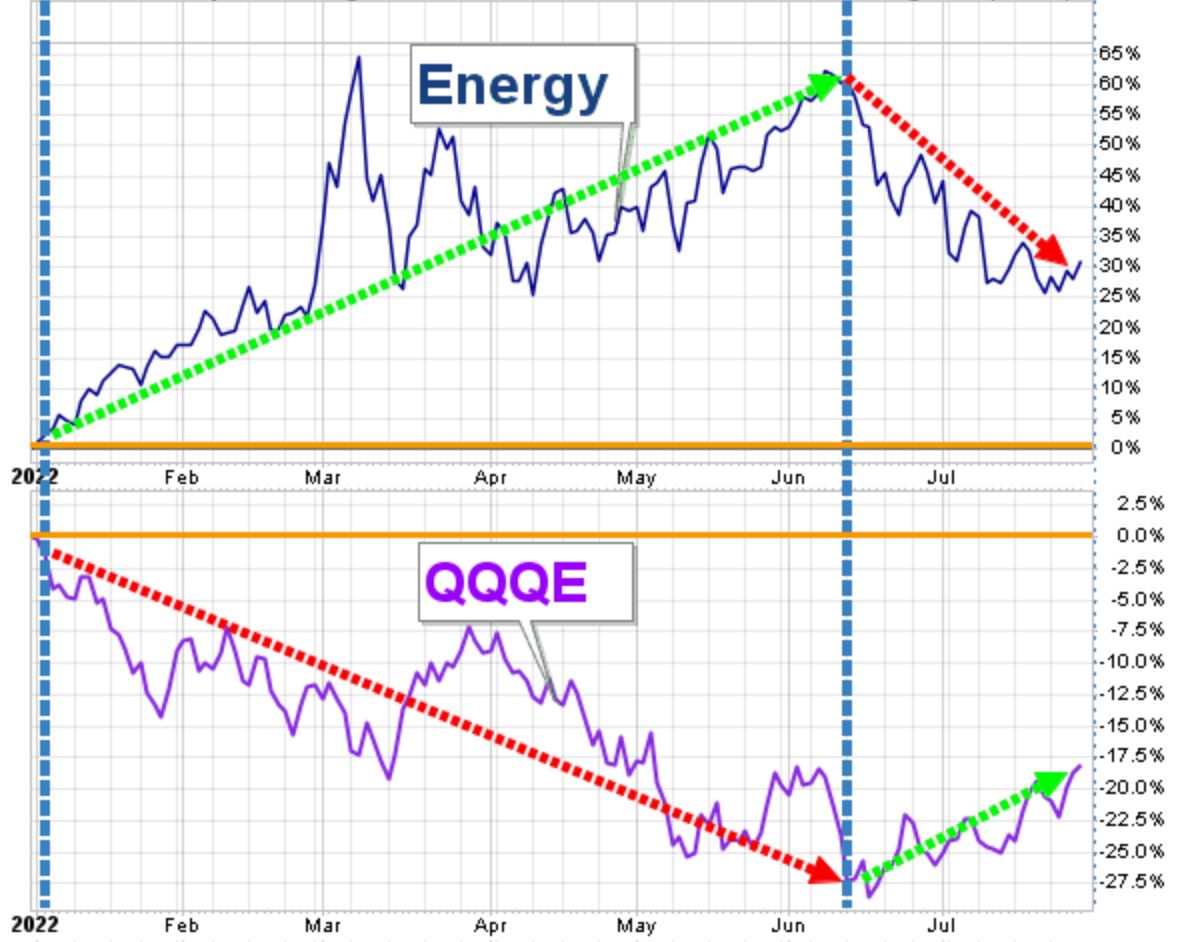
- But, because of inflation, isn’t the energy sector still leading the way up and doesn’t this represent the beginning stage of a bear market, not the beginning of a NEW bull market? No, this is wrong. Energy is now falling and early-cycle (new bull market) sectors are now leading as represented by the equal weight Nasdaq-100 stock index (QQQE). This very important bullish change in leadership is shown here:
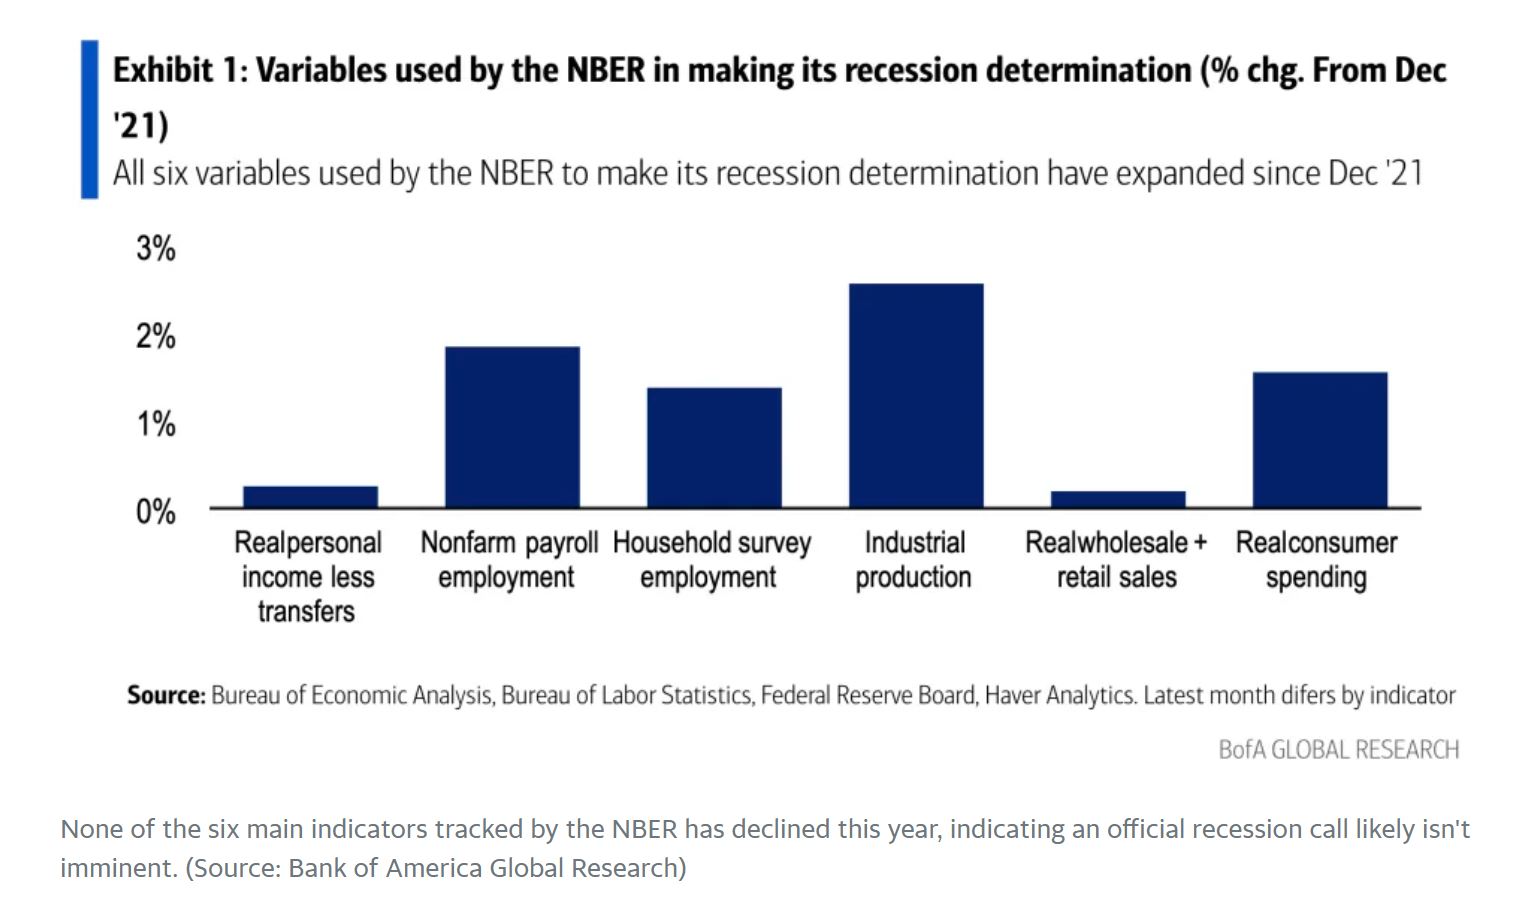
- Okay, but we just got a second back-to-back quarter of negative GDP (Gross Domestic Product) and this means that a recession is just now starting! Nope, in the United States the NBER is the official entity that makes the call on all recessions and all 6 of the components at which they look are still bullish; 4 out of the 6 are still VERY bullish and not likely to change any time soon. Just because numerous people say that we are in a recession does not mean that their pronouncements are factually true. Right now, even the important part of the U.S. interest rate yield-curve (the 3-month to the 10-year) is not anywhere near inverting and thus signalling a recession. (Chart courtesy of the Federal Reserve, NBER and Bank of America)
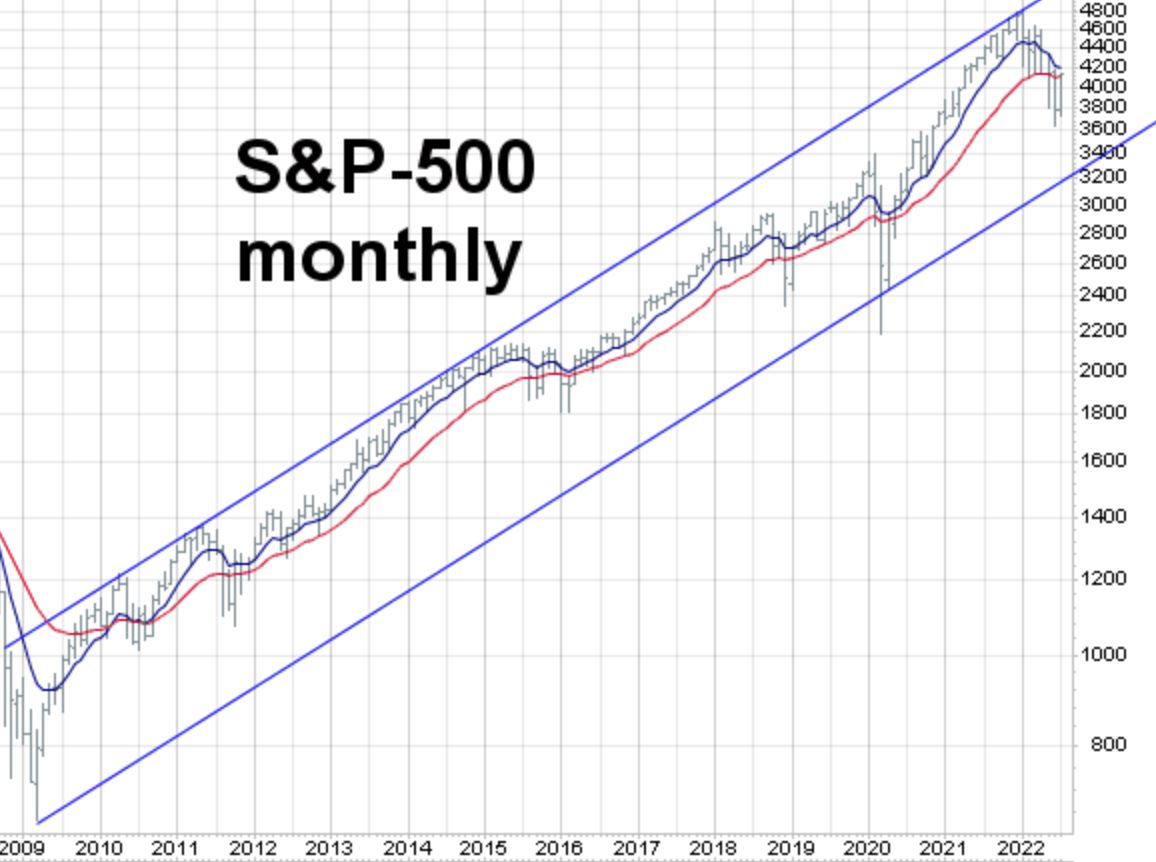
- But wait, aren’t we now in a brand new SECULAR (long lasting) bear market weak period? No, the bullish trend channel is still fully in tact. The trend channel is just one of the things at which we look to determine secular, long lasting cycles, but it is obviously still running up and this means that the secular stock bull market may continue on up for years. The United States has led the way up, has been substantially stronger than other global stock markets, and it will continue to lead until this secular cycle comes to an end. MarketCycle has been correctly positioned almost entirely in U.S. stocks since April of 2009.
Thanks for reading!
MarketCycle Wealth Management is in the business of navigating YOUR investment account through rough waters. Give us a chance, we earn our keep! It is easy and we help with the change.
The REPORT website can be reached via the link on this website.
***
MARKET CYCLE — TREND FOLLOWING — DUAL MOMENTUM — LOW VOLATILITY — HEDGE FUNDS
