MarketCycle Wealth Management

Brief Blog About Bullish Breakouts
This blog was written on the morning of Thursday, December 1, 2022.
Educated investors perform their job via fundamental analysis (looking at recent but still past economic and corporate data), or via technical analysis (looking on price charts for repeatable current patterns and possible future patterns, etc.) or, like me, they do a combination of both. Part of my extremely long ‘education’ was in learning which incorrect indicators and systems to avoid (90%?) while creating an entire proprietary system of accurate in-house indicators.
As I’ve repeatedly stated, much of technical analysis only works because millions of traders all across the globe believe that it works and when they see something important occur, they all move in unison, like a school of fish, thus creating a self-fulfilling prophecy.
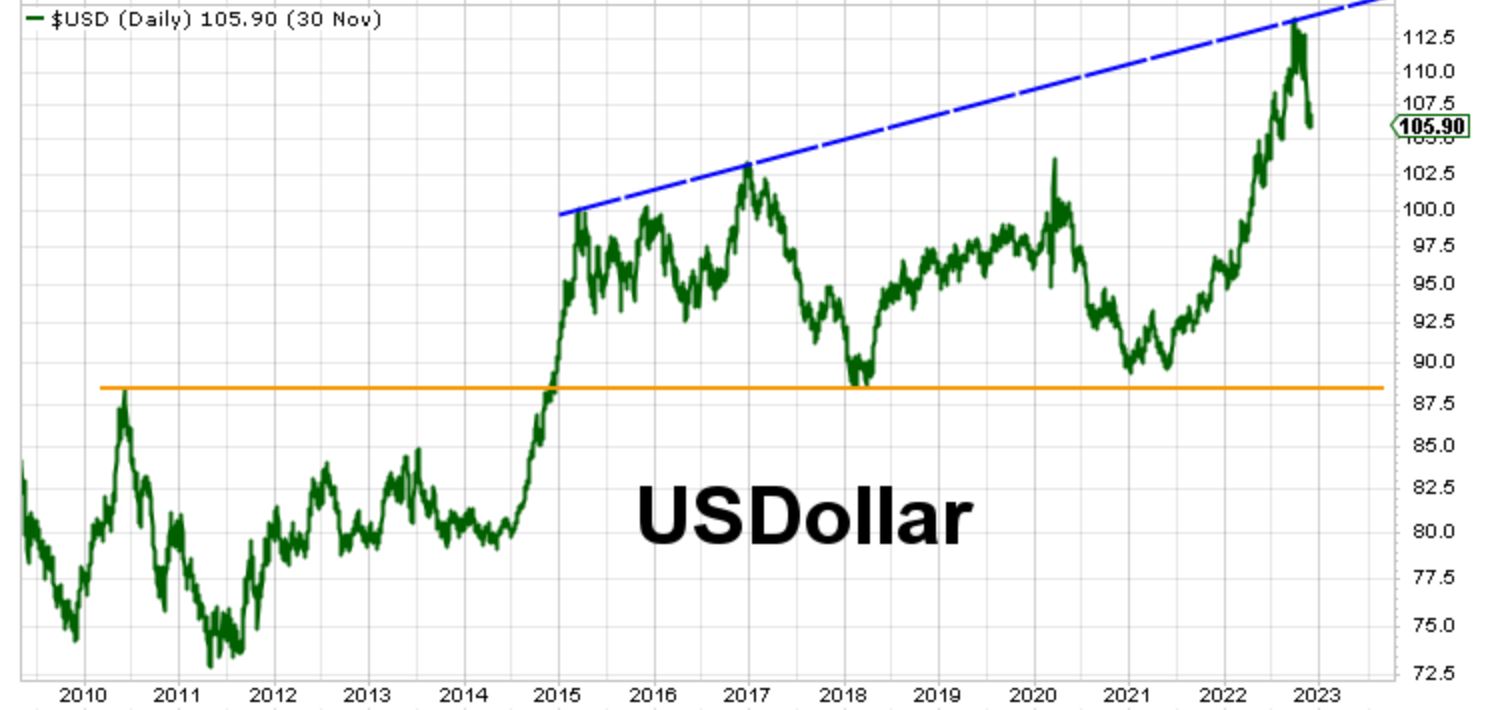
This week has already been an important week for technicians. When an asset, on its price chart, breaks above overhead resistance created by a trendline or by a prior high, then it is often “off to the races” for the now bullish asset. After breaking through an important overhead resistance line on a price chart, it almost always moves back down to retouch the same line from above, confirming that the same line is now a support line. And if it fails to break through overhead resistance, this is often telling the story of a possible pullback, as we just saw with the USDollar.
Please note that all strength, as I’ve been repeatedly saying, is in the United States. The rest of the world’s economies are falling apart. One should always invest where the strength is. Our indicators say that the U.S. may get a mild recession in 2023 but that it most likely is a soft landing that affects the economy and only minimally affects the stock market. I still believe that we have seen the lows of this bear market. We might get a temporary and relatively mild pullback in February(?) before heading higher again. Bears don’t live forever… this one is already gasping and grasping for its last breath.
With investing, if you want to wait until you feel good about the economy, then you are likely going to leave a heck of a lot of money behind and in someone else’s hands… stocks lead the economy by about 9 months.
IMPORTANT BULLISH PRICE BREAK CHARTS:
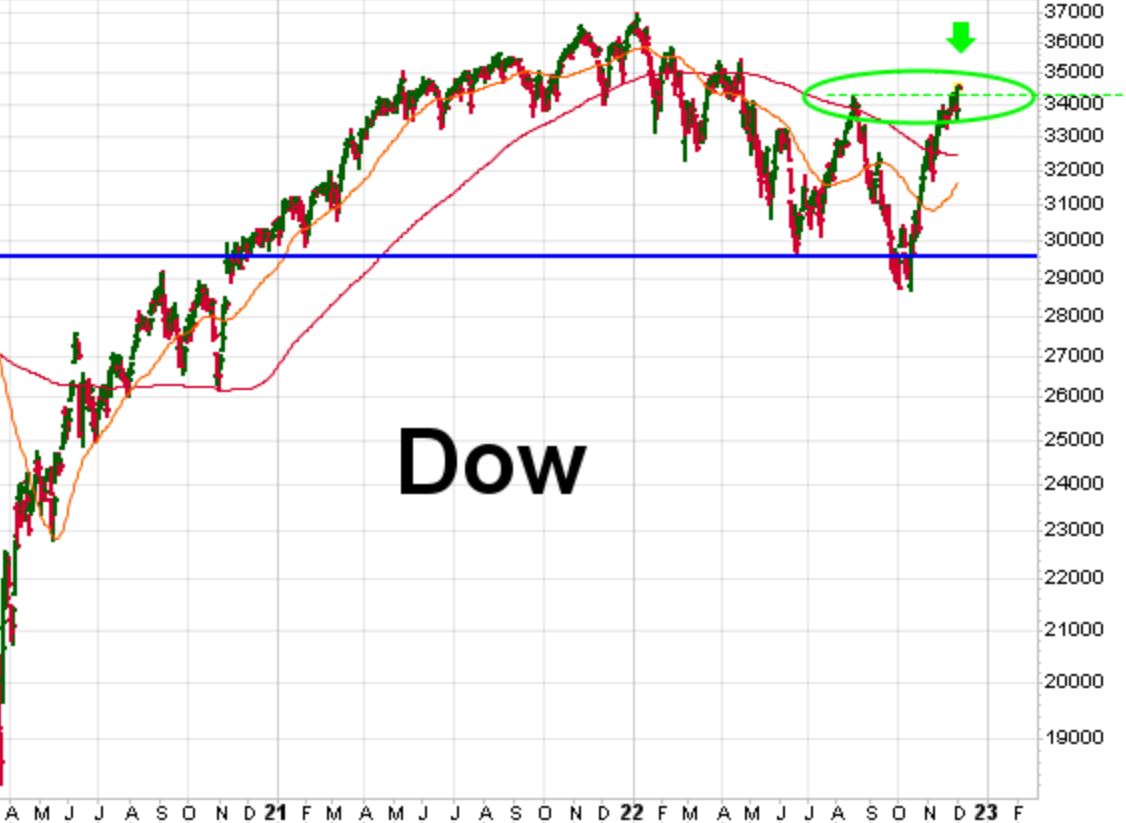
The Dow stock index has broken above its trendline, broken above its 50 day moving average, broken above its 200 day moving average and now it has broken above the prior high created during the mid-summer of 2022 (see the green arrow). Higher-highs are very bullish. [NOTE: This chart offers a pretty clear image of investor’s totally overblown fears during 2022. Right now, the 2022 bear market (that started on January 1st) looks fairly insignificant.]
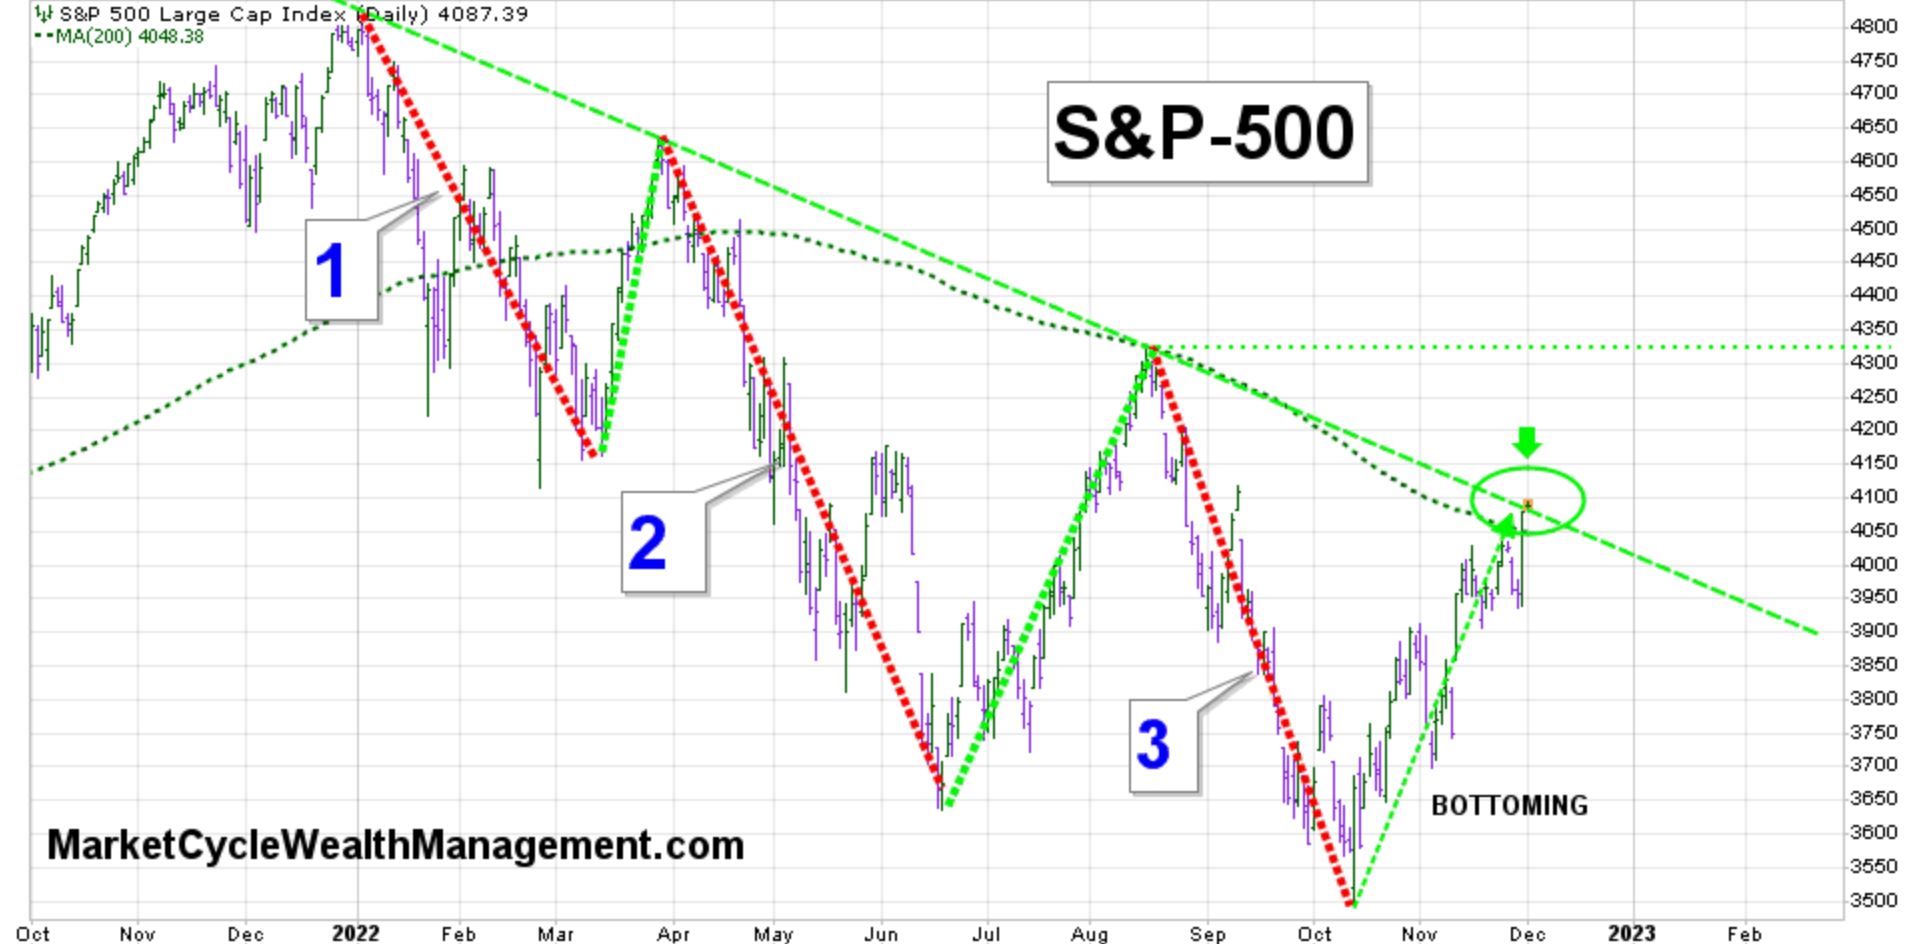
On Thursday December 1st, the S&P-500 stock index followed the Dow by moving above its one year long trendline (see the green arrow); it had been unable to do this during the two prior advances in March and August of 2022. The S&P-500 has finally broken above its moving averages. This line break is bullish for stocks even if it pulls back in the short term.
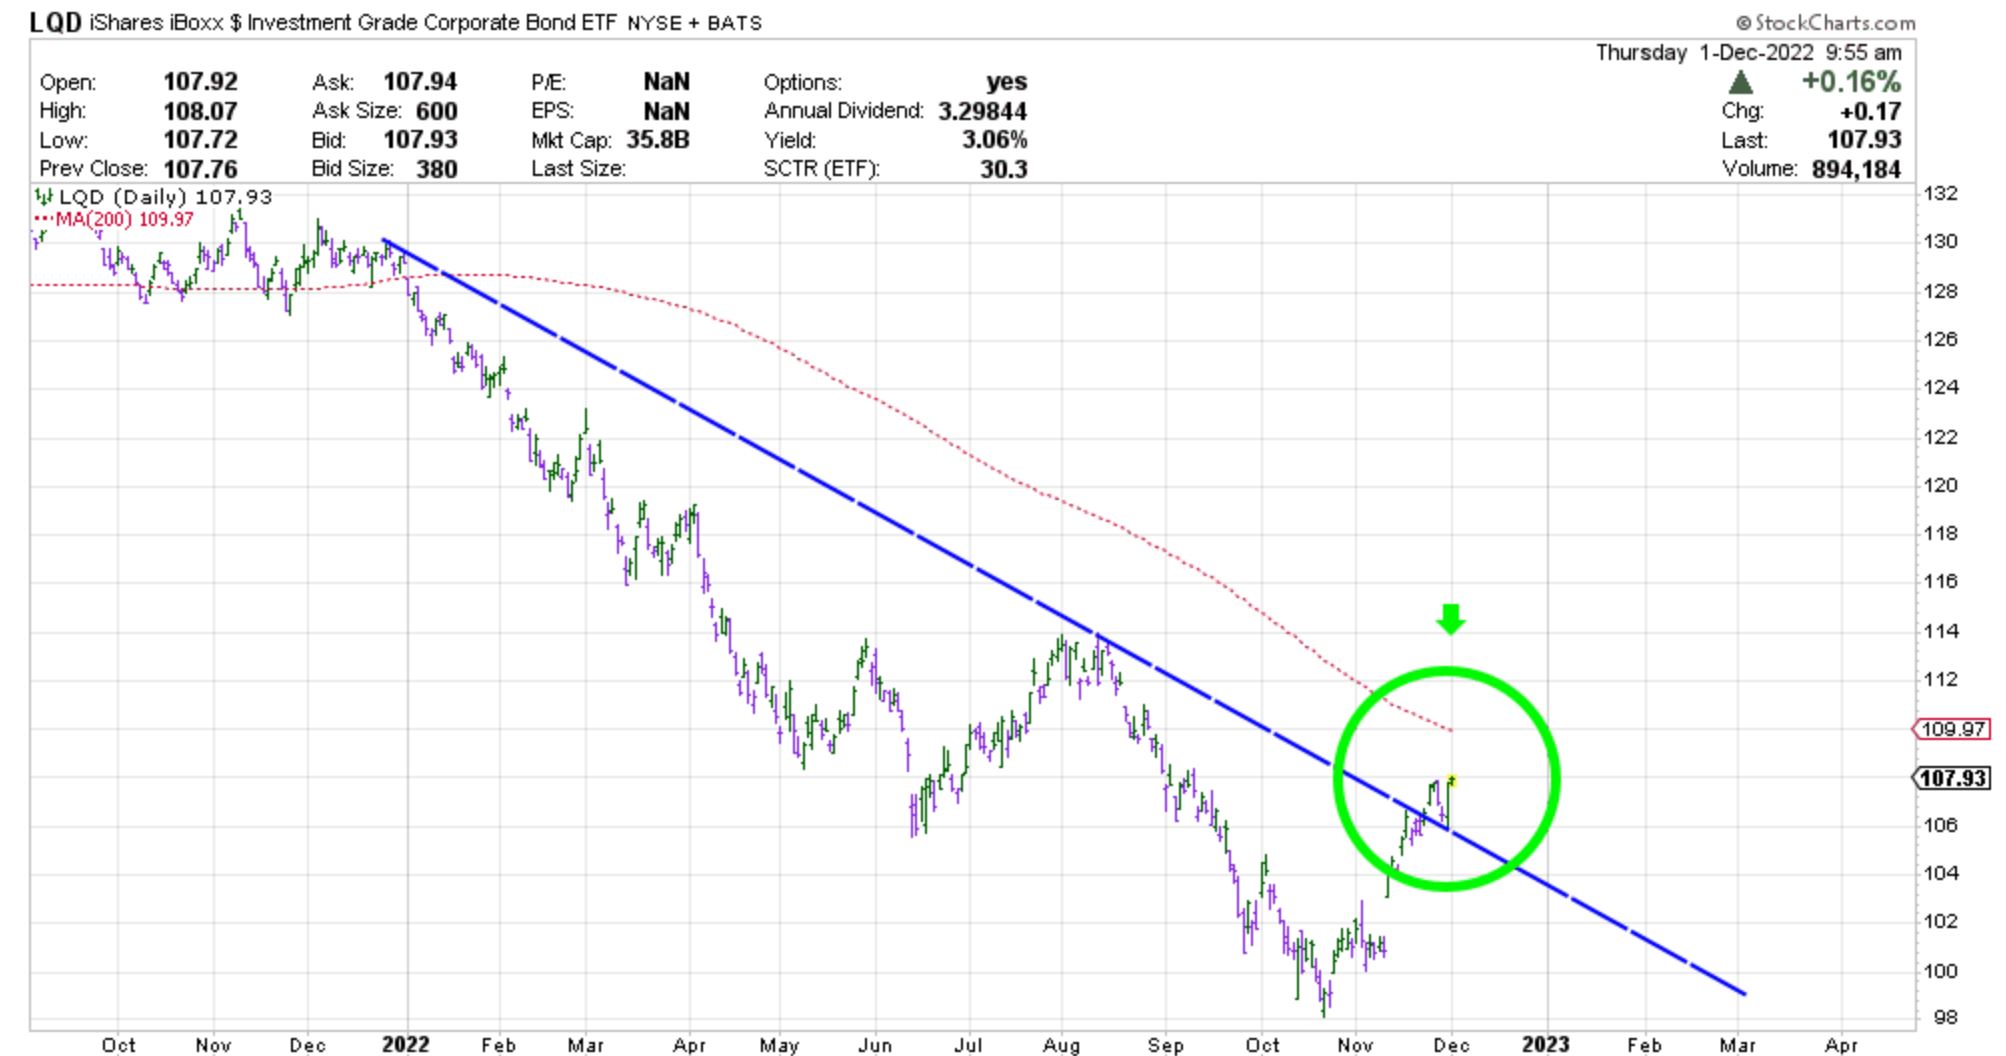
Corporate bonds, bonds issued by corporations and paying interest, have recently also broken above their downward sloping trendline (see the green arrow). This is bullish for corporate bonds. HIgh yield bonds are likewise now showing strength.
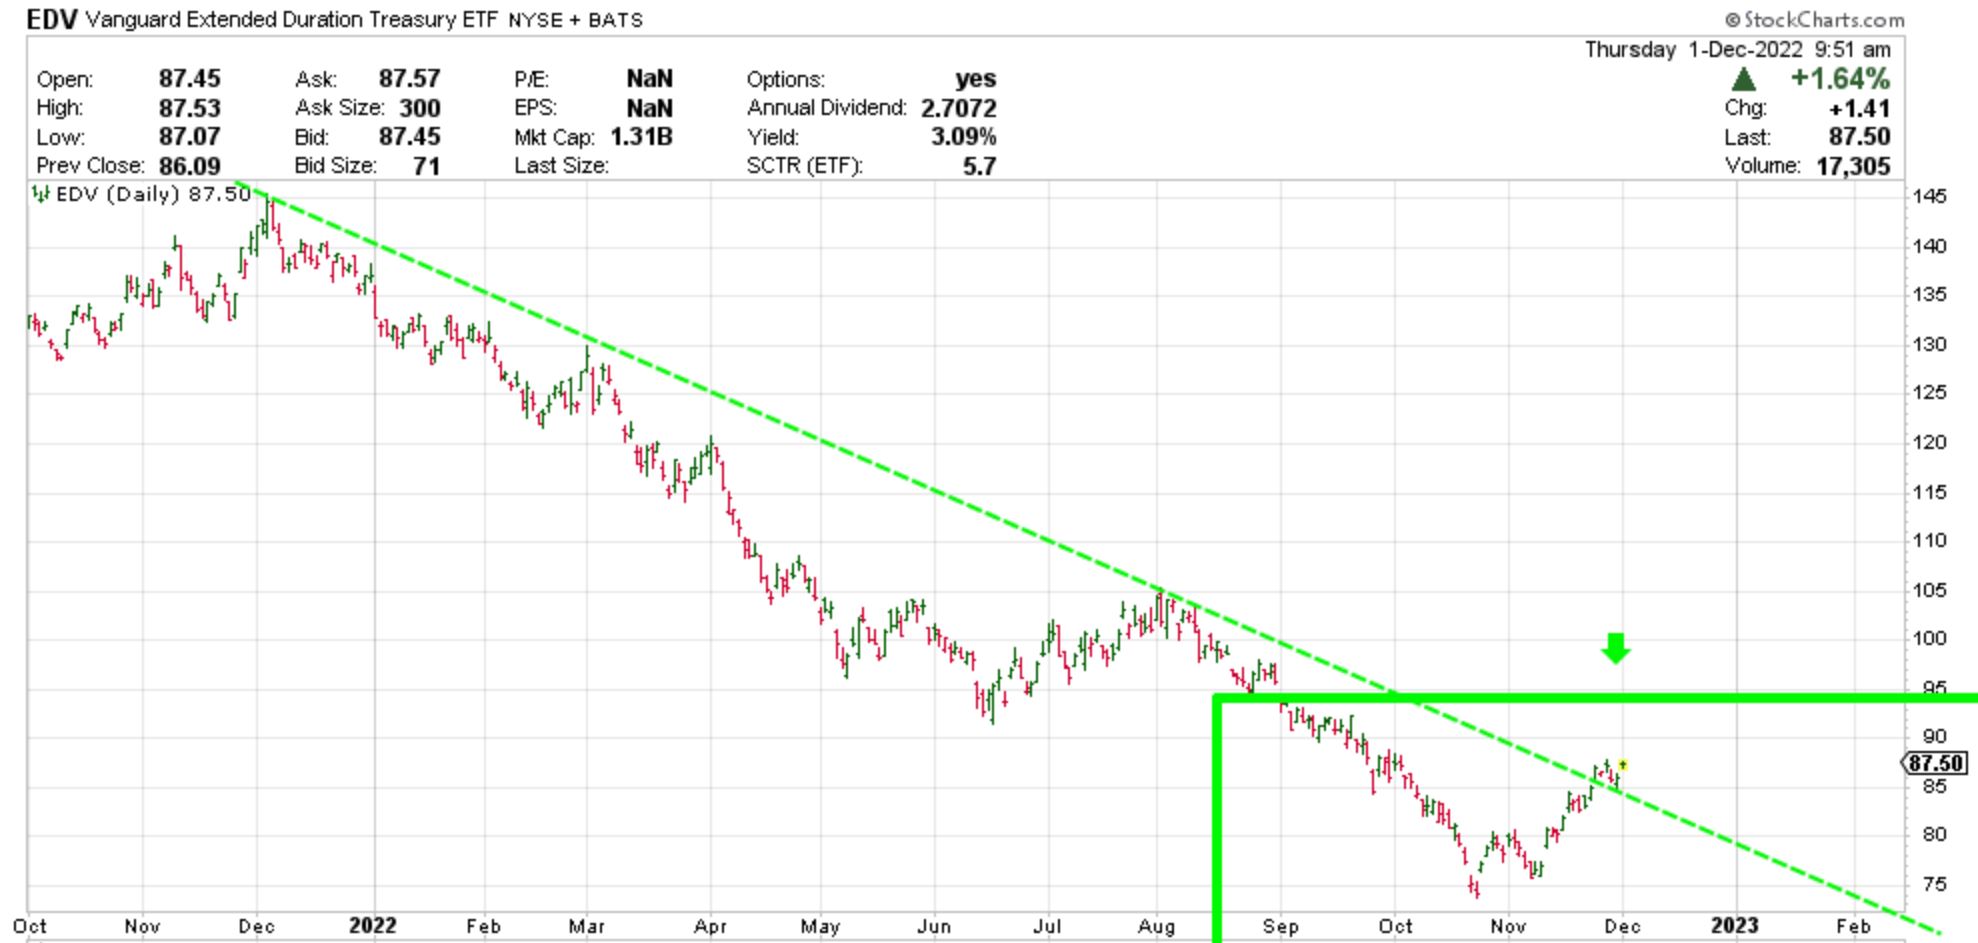
Government issued Treasury-bonds normally offer portfolio protection. When stocks go down, they usually go up. This hasn’t worked so far this year, which is unusual because even during the decade long stagflation period of the 1970’s, they substantially beat stocks in price gains. I have to constantly remind myself that there are a lot of inexperienced traders influencing today’s markets, so now things can play out differently.
T-bonds have now broken above their year long downward sloping trendline (see the green arrow). This is bullish and it is very important. Portfolio protection that pays interest and offers price gains; insurance that pays us to hold it.
And finally, as I predicted, the USDollar was NOT able to move above its trendline and this is somewhat bearish for the USD. However, the bearish USDollar may prove to be a bullish tailwind for both U.S. stocks and for U.S. bonds.
Thank you for reading!
MarketCycle Wealth Management is in the business of navigating our client’s investment accounts through rough waters. We strive hard to earn our keep.
Our REPORT subscription service is available via the link on this website.