.
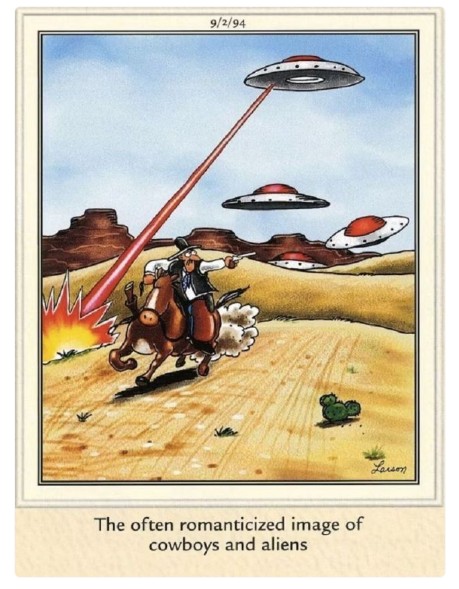
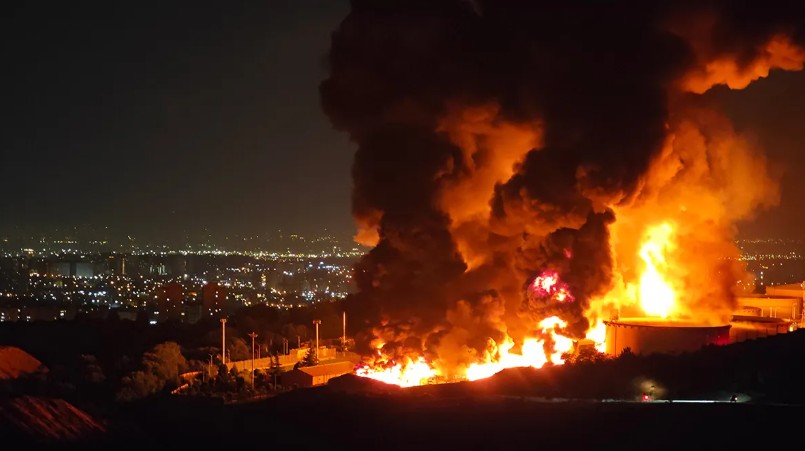
America is bogged down in yet another war, this time without the approval of Congress and without NATO allies assisting us. The damage is profound, the cost is stunning and the gift just might be a global multi-month recession. In just the first few weeks of bombing, this war has created the largest oil disruption since World War II.
When oil prices rise more than 100%, the S&P-500 typically moves into a recession that is coupled with a stock bear market. Non-US grades of oil are already beyond 100% with some Asian economies reaching a 165% increase in oil prices. “Out of gas” signs are showing up at gas stations all across the globe.
Iranian missile and drone attacks are ratcheting up, not down. Iran seems able to tolerate declining economic conditions better than many other countries. The Wall Street Journal is reporting that Iran’s peace demands include the removal of all (three are already obliterated) U.S. bases from the Gulf Region and that Iran be allowed to take total control of the Strait of Hormuz, which would include the ability to collect high $-tolls.
Each week of this war, the U.S. has gone through the same number of missiles and rockets that the United States can manufacture in one year. Re-supply may never catch up; the cost will be sky high. The amount of rare & critical minerals that are needed for these weapons is astronomical (MarketCycle’s client accounts bought a “rare and critical minerals” ETF back in early February, before the bombing started). The United States is quickly running into the same trap that Russia got caught in with Afghanistan and Ukraine.
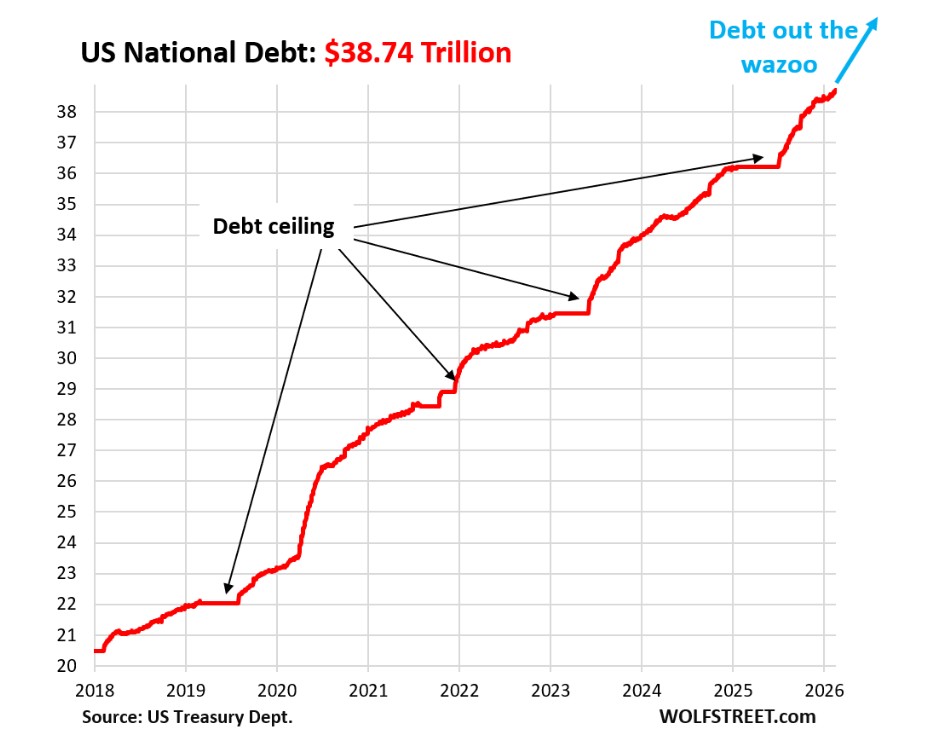
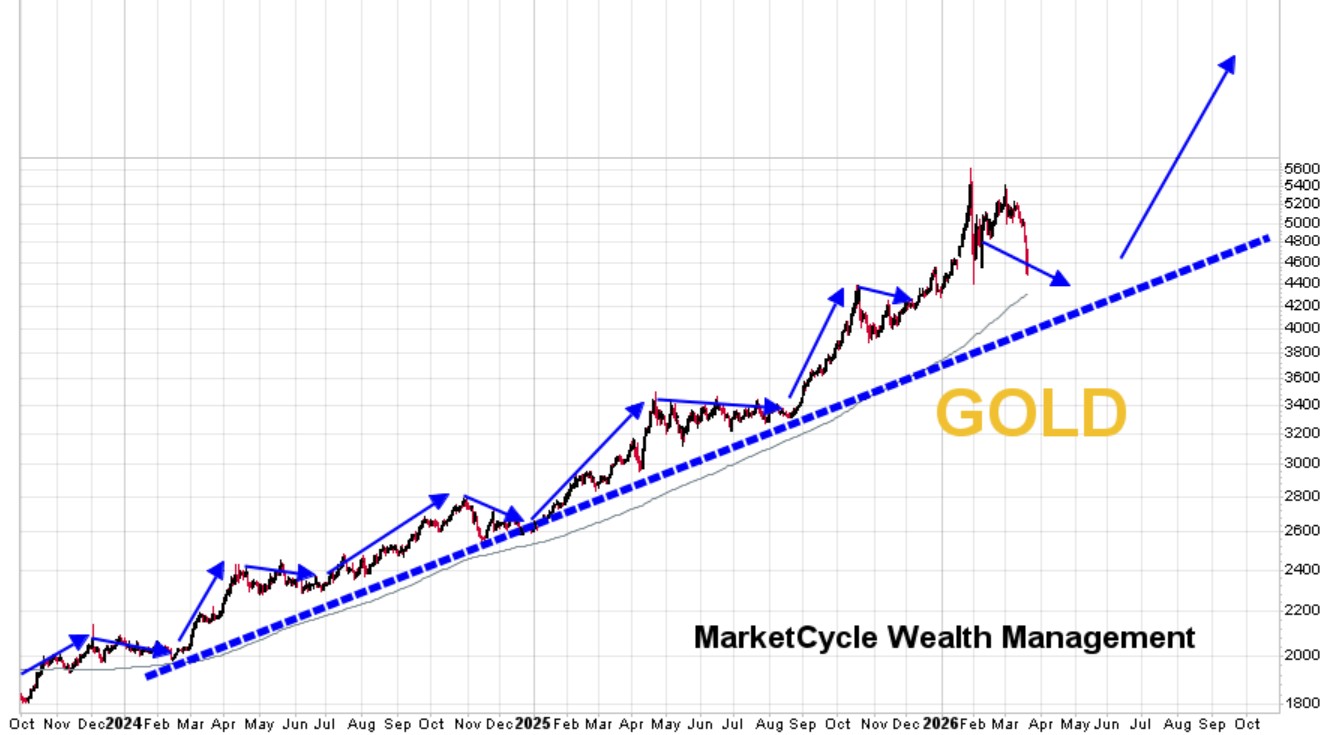
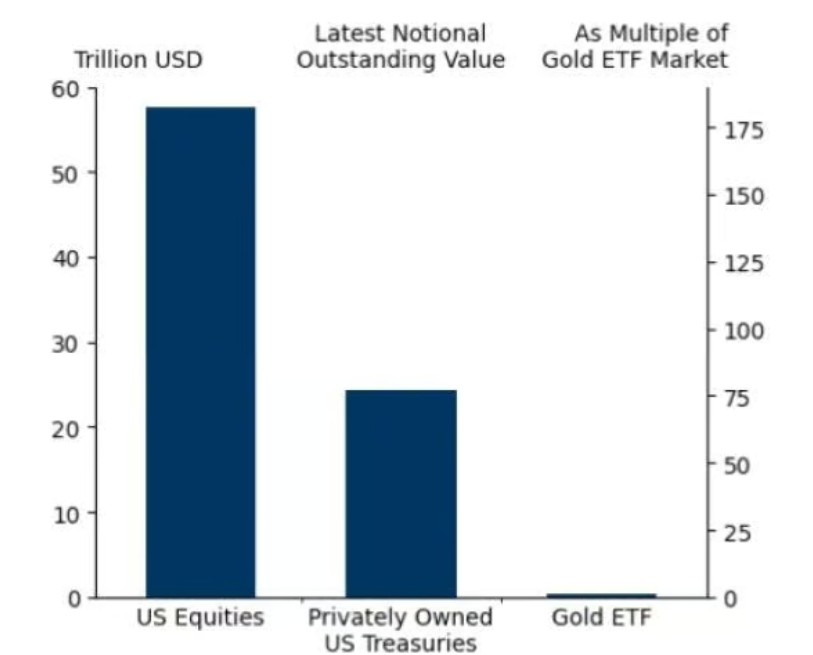
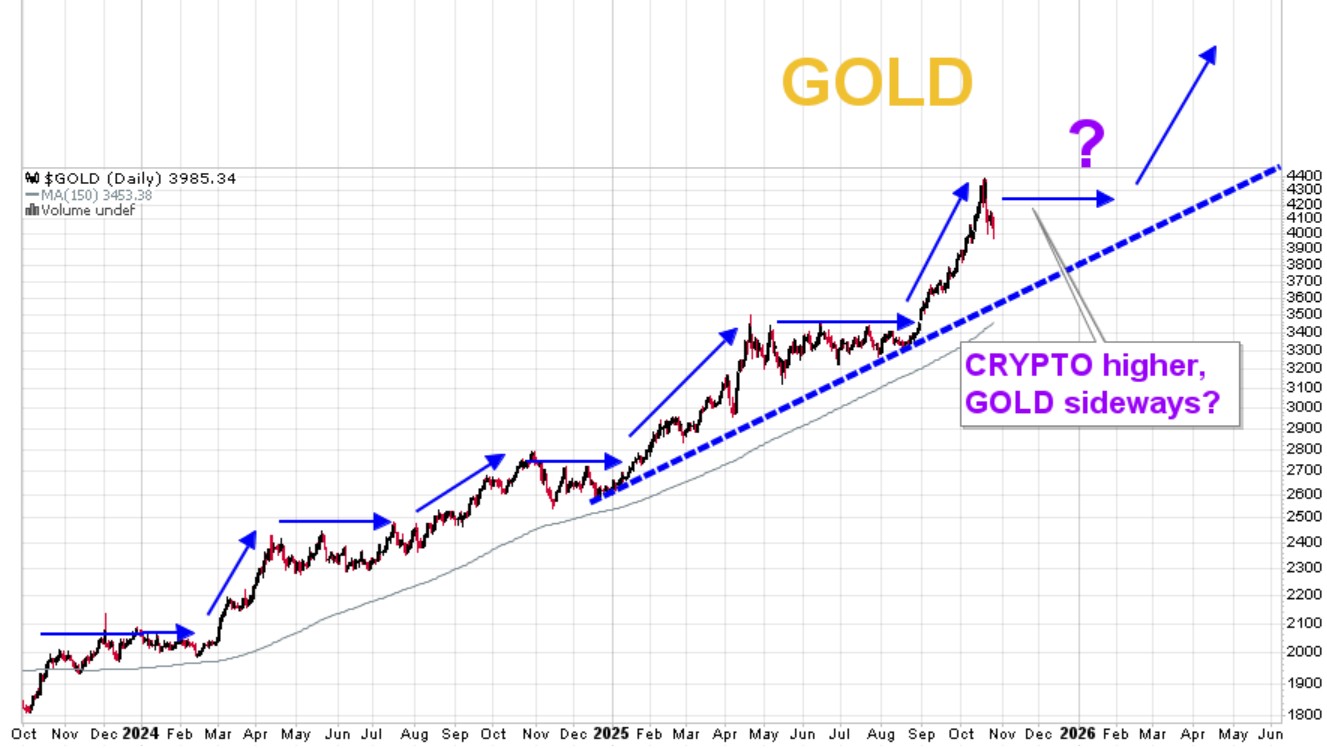
Things, including bombs, cost real money. Our National Debt is going straight up. Within a few years, our debt will become unmanageable. Someone recently asked why we hold so much physical gold in our client accounts; “debt and non-stop money printing” was my answer.
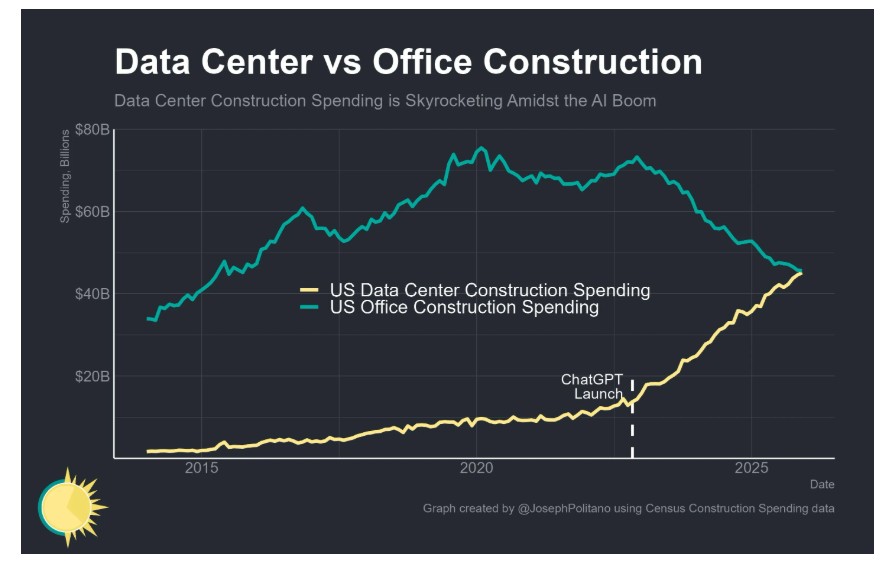
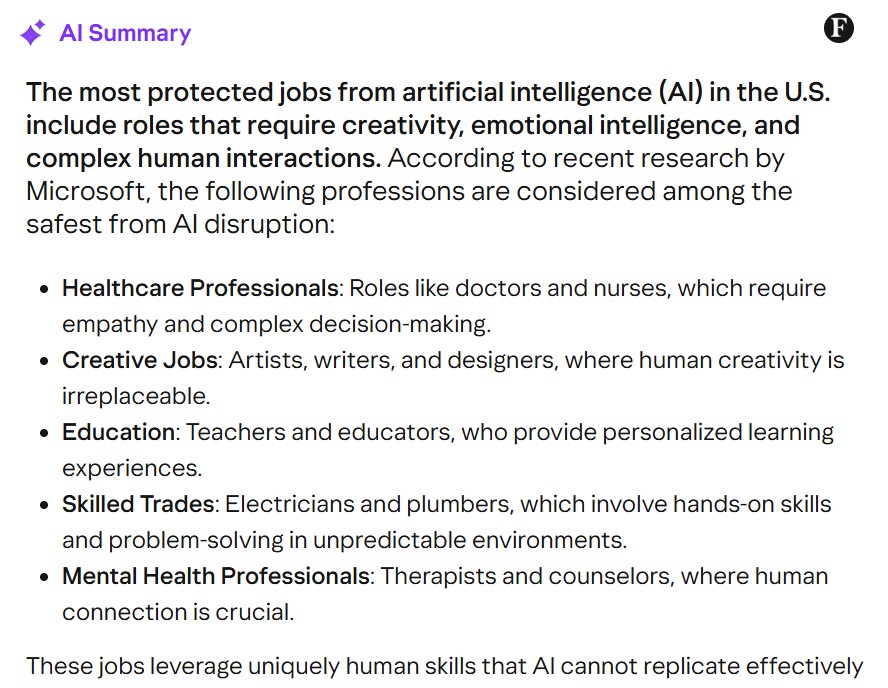
When all is said and done, it might take one year to get oil facilities operational again and several years to obtain full capacity. (The AI & technology sector is relatively insulated from this lack of supply and clean energy may skyrocket, especially since wind and solar can be placed on top of the gigantic data centers.) The disruption from this war represents 20% of total oil destruction; that is a lot. Global GDP will fall. (GDP = Gross Domestic Production of all products and services.)
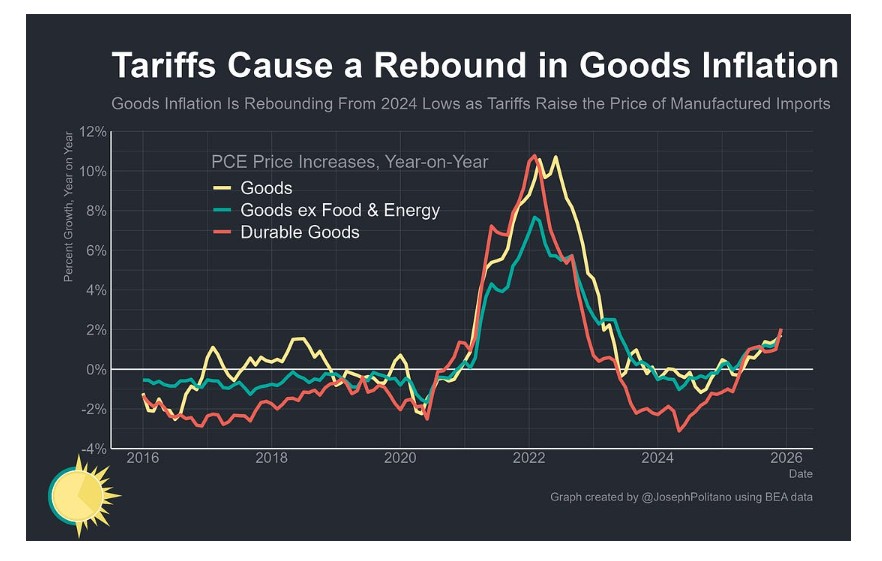
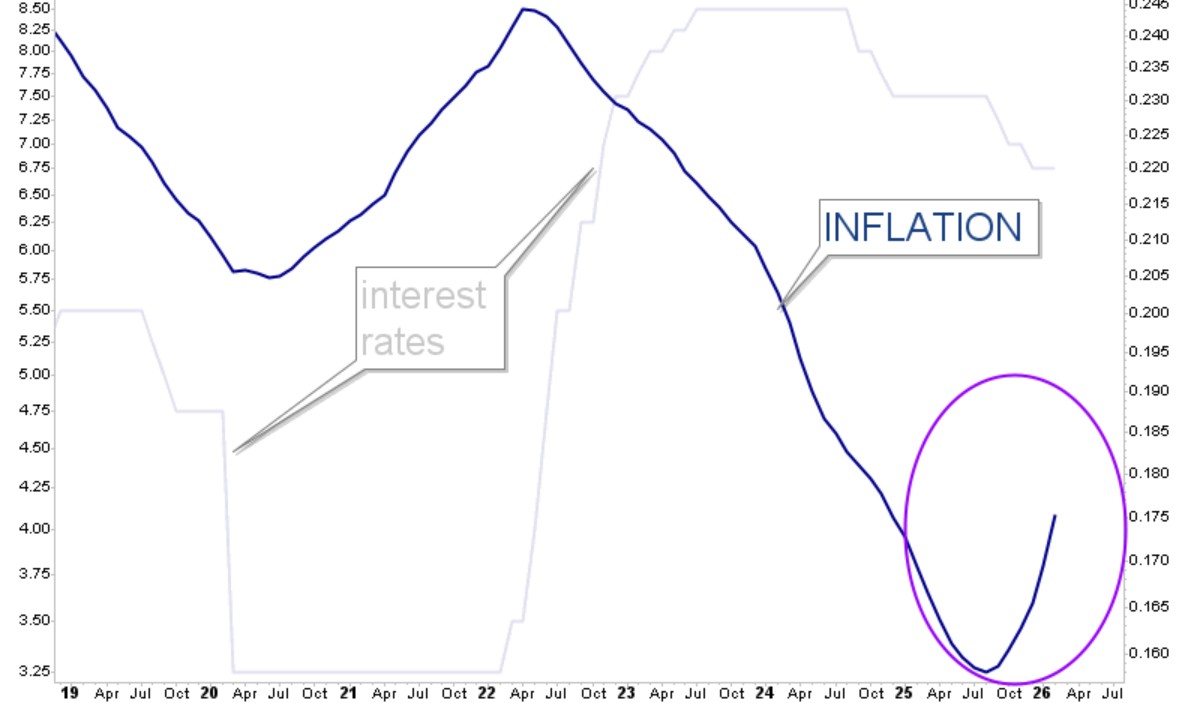
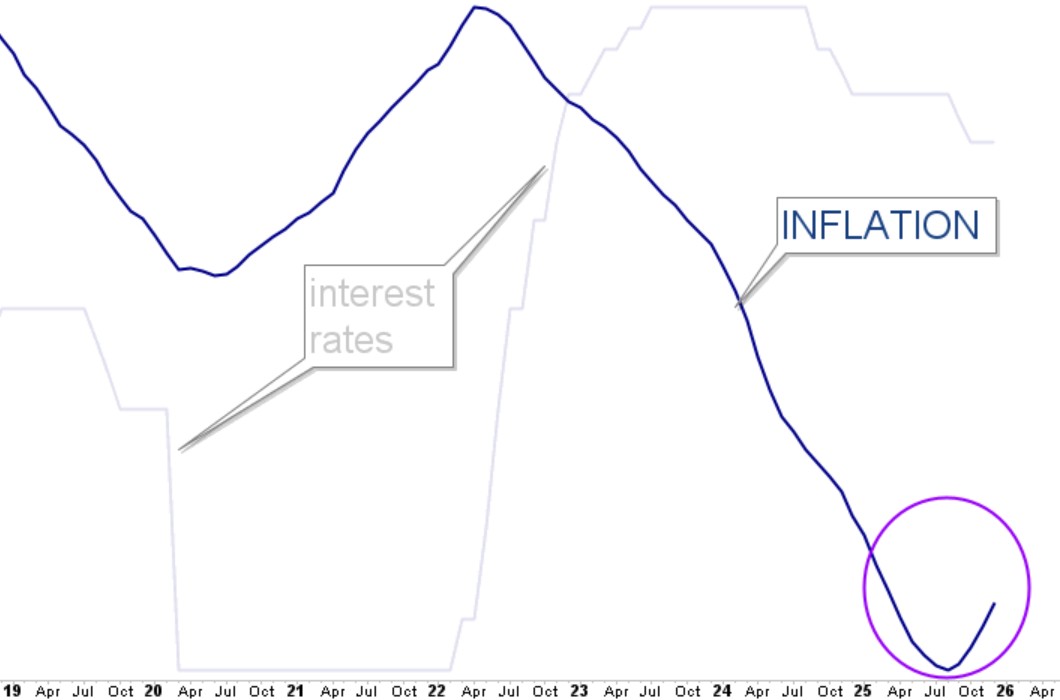
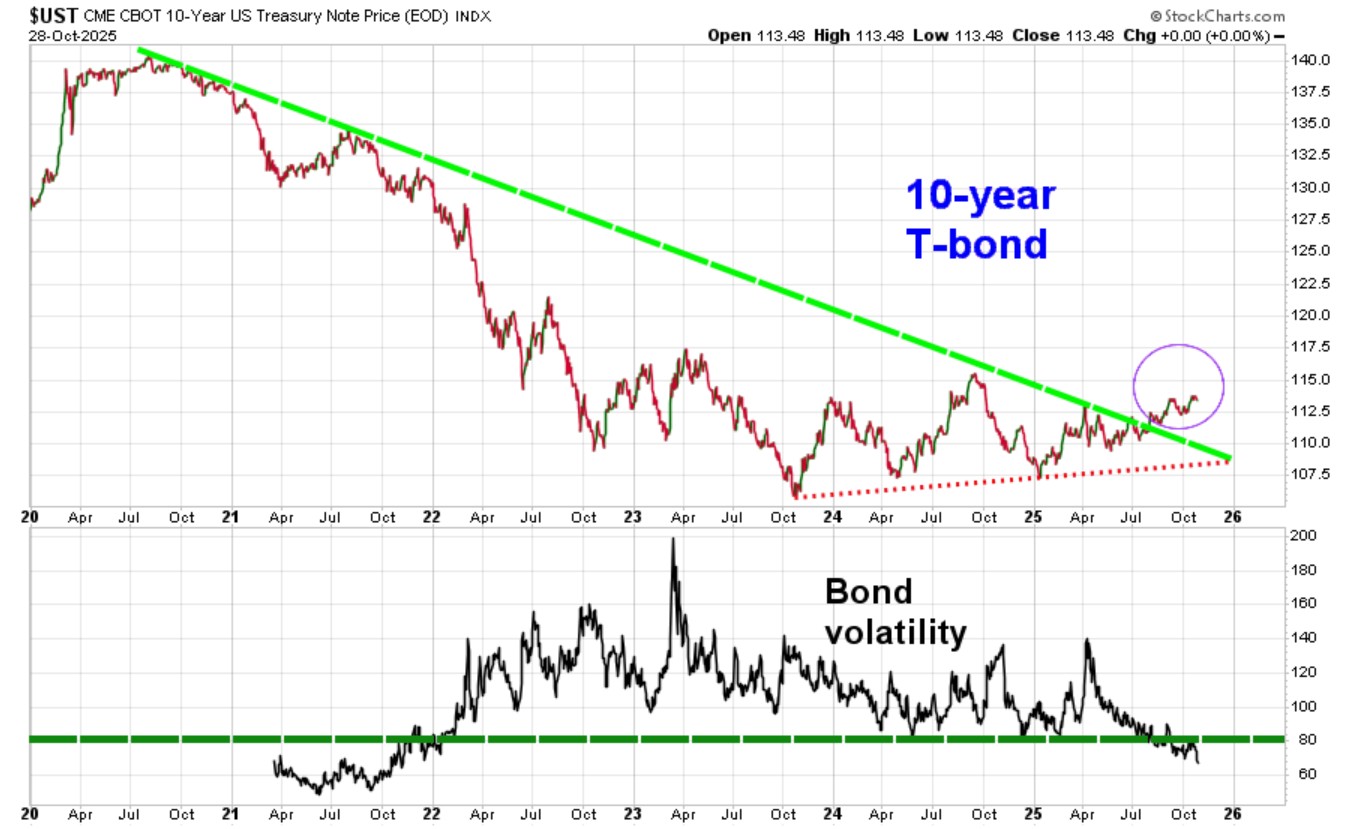
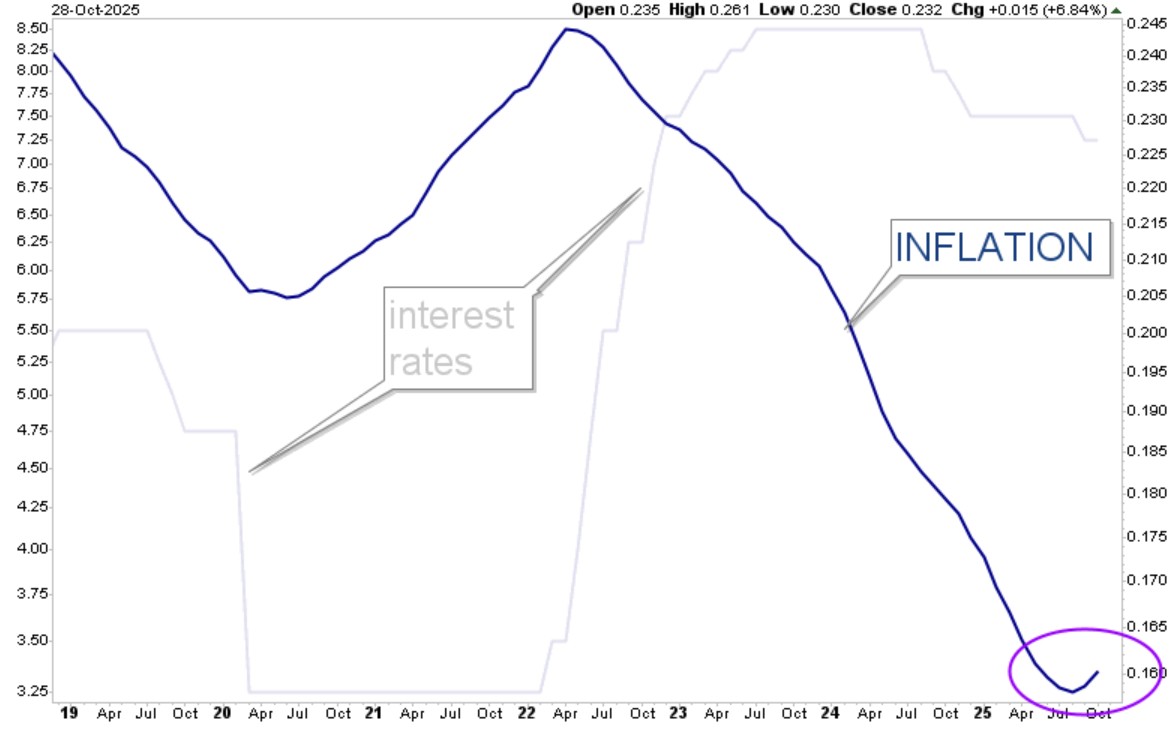
Inflation will rise higher and because of this, the Federal Reserve will not be able to safely lower interest rates. Since fertilizer is made from oil, food prices will increase. And jet fuel & gasoline & shipping fuel costs will jump higher in price. Plastics, pharmaceuticals and clothing fibers will cost more. Construction will also cost more.
Already built renewable clean-energy sources will help the countries of: Sweden, Switzerland, France, Finland, Brazil, Bulgaria, Hungary, Denmark, Slovakia, Portugal Austria and New Zealand. Under our new administration, the United States has already gutted its clean and renewable energy projects, so we get no help there.
Oil? The United States is slightly protected because we are an energy exporter (because of shale deposits). If we continue to primarily export these oil and gas supplies to other countries, it may not help the average U.S. citizen. Of course, it would help a few corporations.
So, what could make things better? Ending now, pulling out and just declaring a “victory” so that ALL of the bombing stops. But as I type this on Sunday evening, we now have 15,000 troops in the war zone.
What could make things worse? Continuing to use bombs with the highest destructive ability; the U.S. is currently using GBU-72 bombs on Iran and these are just below nuclear in destructive ability. And if Iran mines the Strait of Hormuz, or if it sinks a large ship at the tightest point, then all oil shipments through the area would halt.
What could further cripple the global economy? If the Iran backed Yemen Houthi Army places water-mines or sinks a large vessel in the all-important (and narrow) trading route of Bab al-Mandab Strait (between Yemen & Saudi Arabia and the Horn of Africa), as they are already threatening to do.
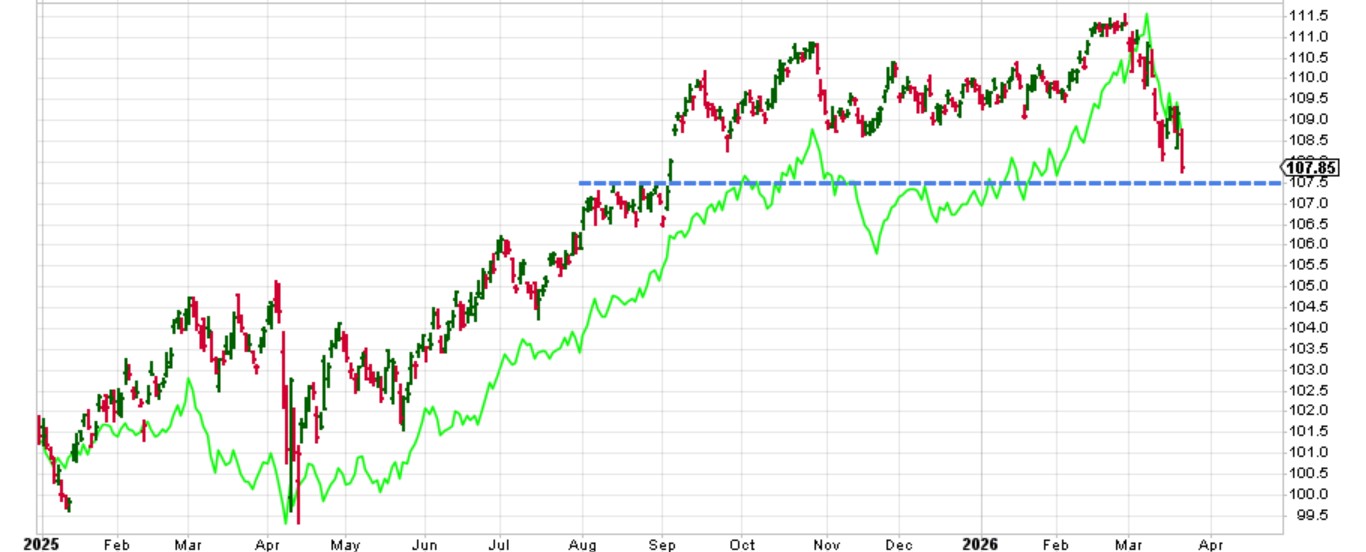
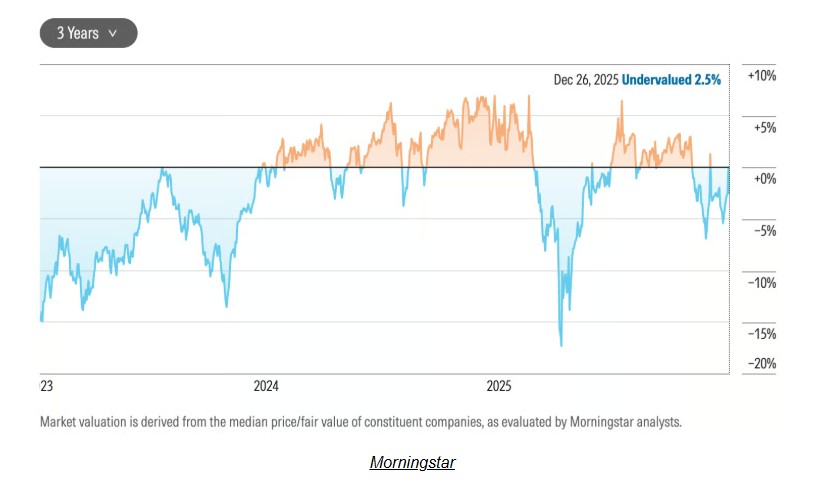
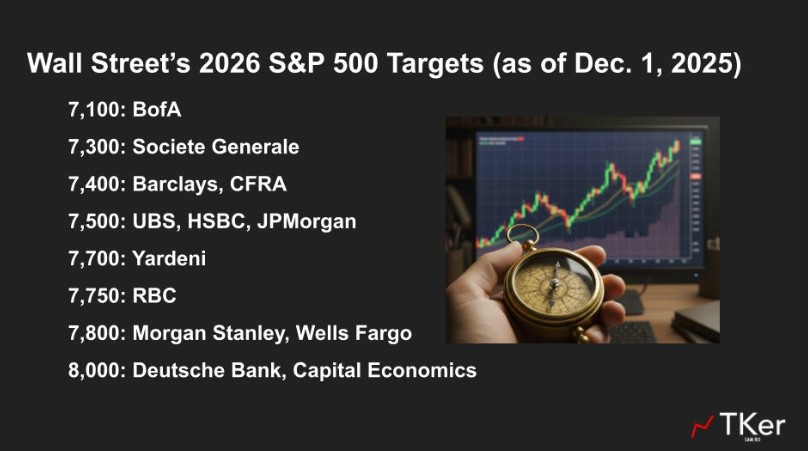
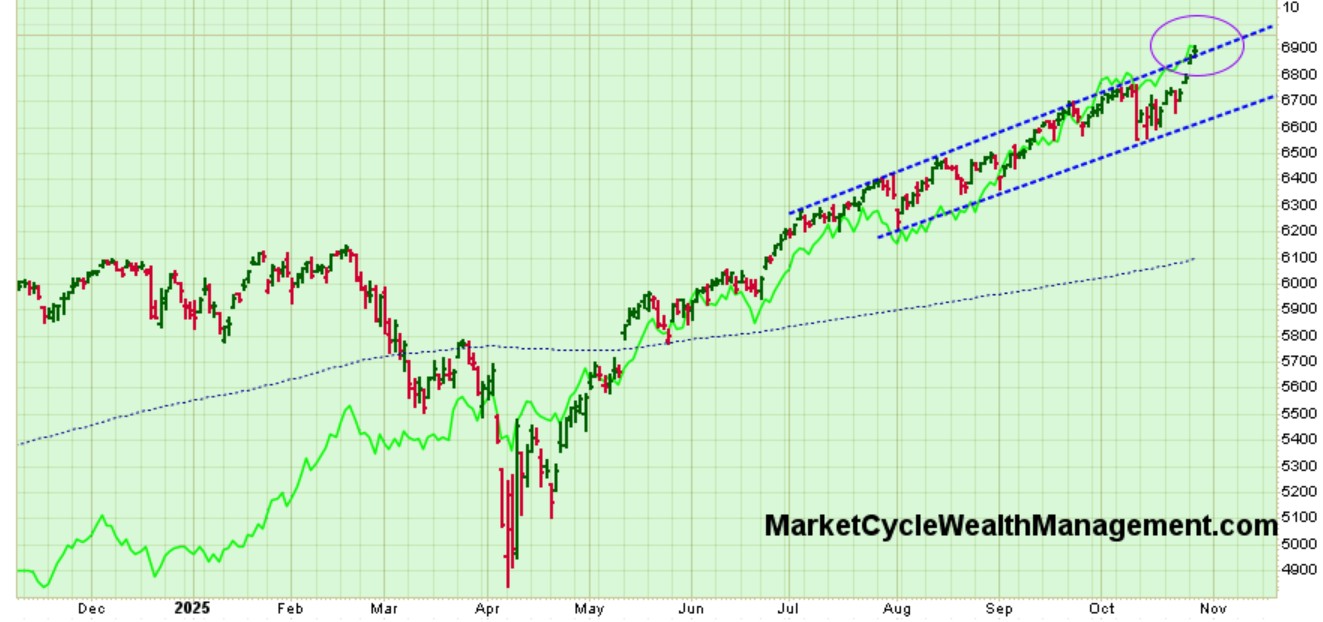
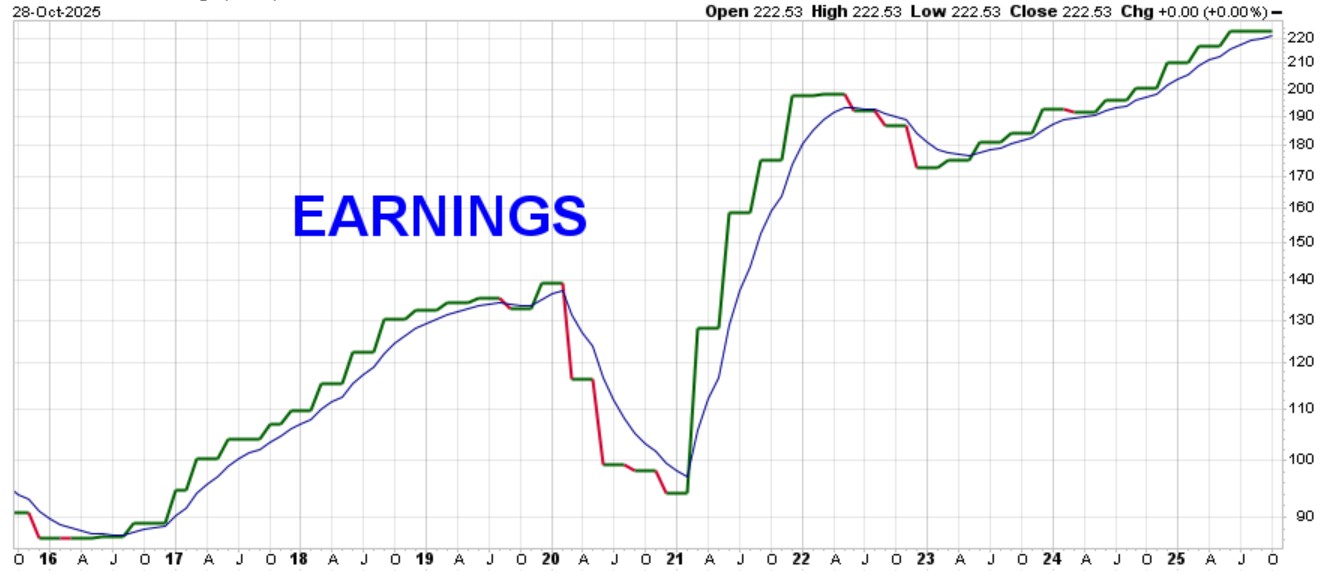
I do understand how horrible this all sounds, but before too long we will be looking back at this from a safer future and a much stronger stock market. I still believe that the next 2.5 years will be the strongest stock bull market in history. I also believe that we will soon get a big bounce higher before any further downside would continue. I have already pinpointed where I believe stocks would drop in a worst-case scenario, and it isn’t too bad. Luckily, before stocks began their recent drop, the stock market had moved sideways for five months and that let off a lot of pent-up steam ahead of the drop… and that gradual release of pent-up steam will come to our rescue by limiting the downside to “manageable.”
.
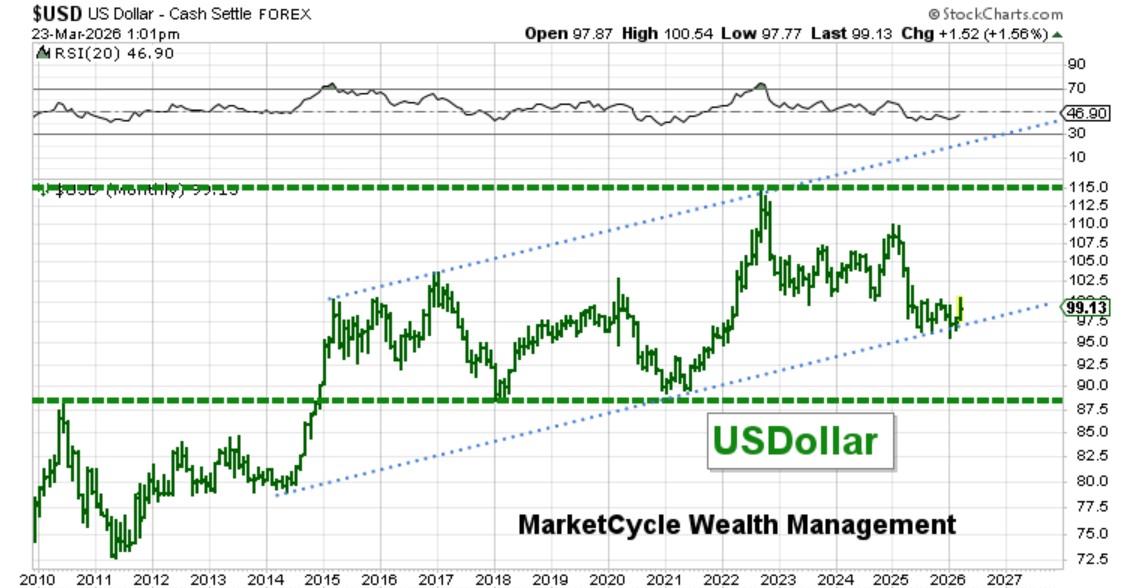
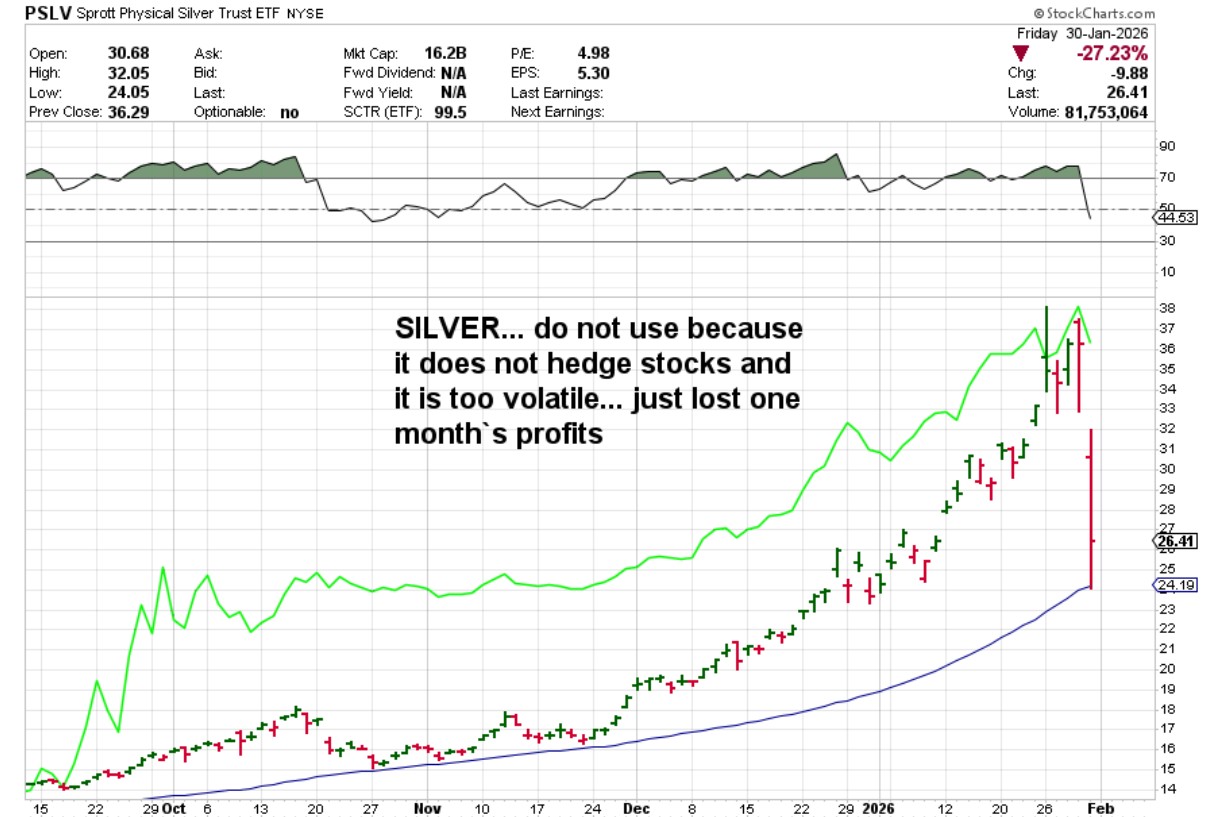
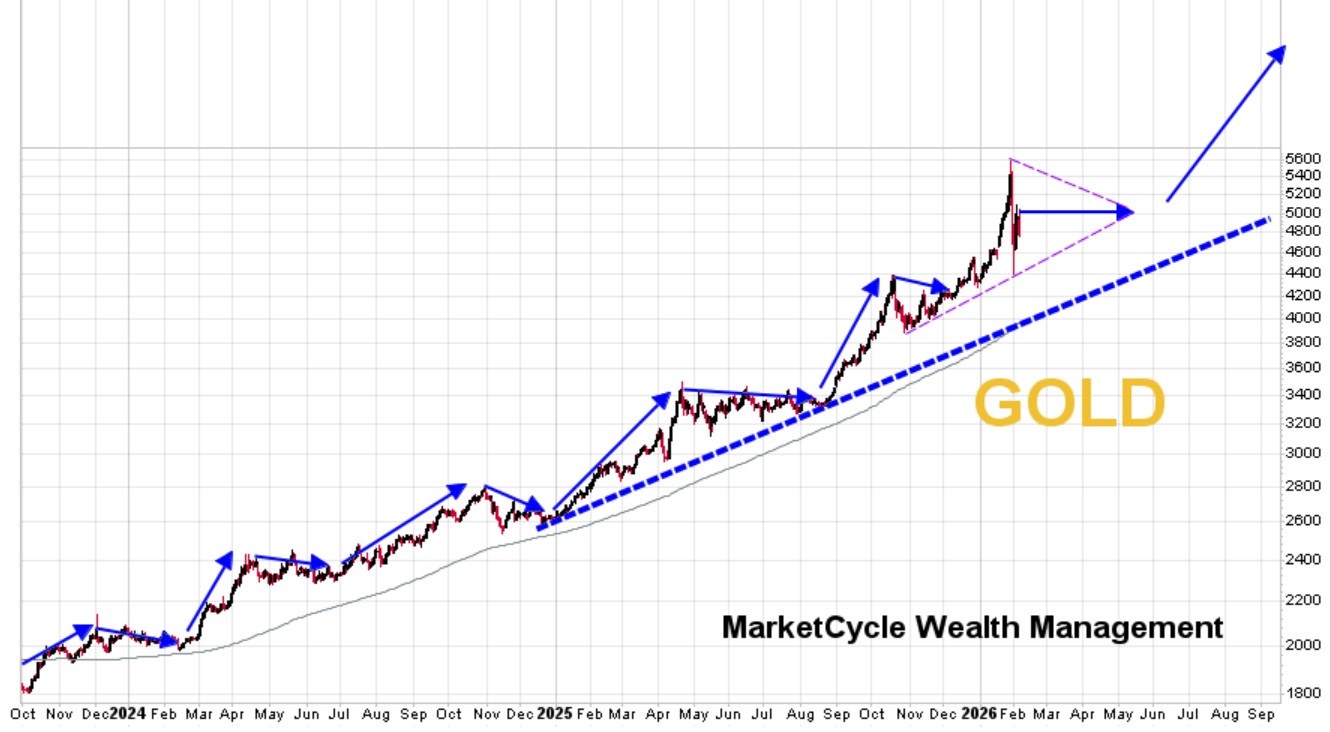
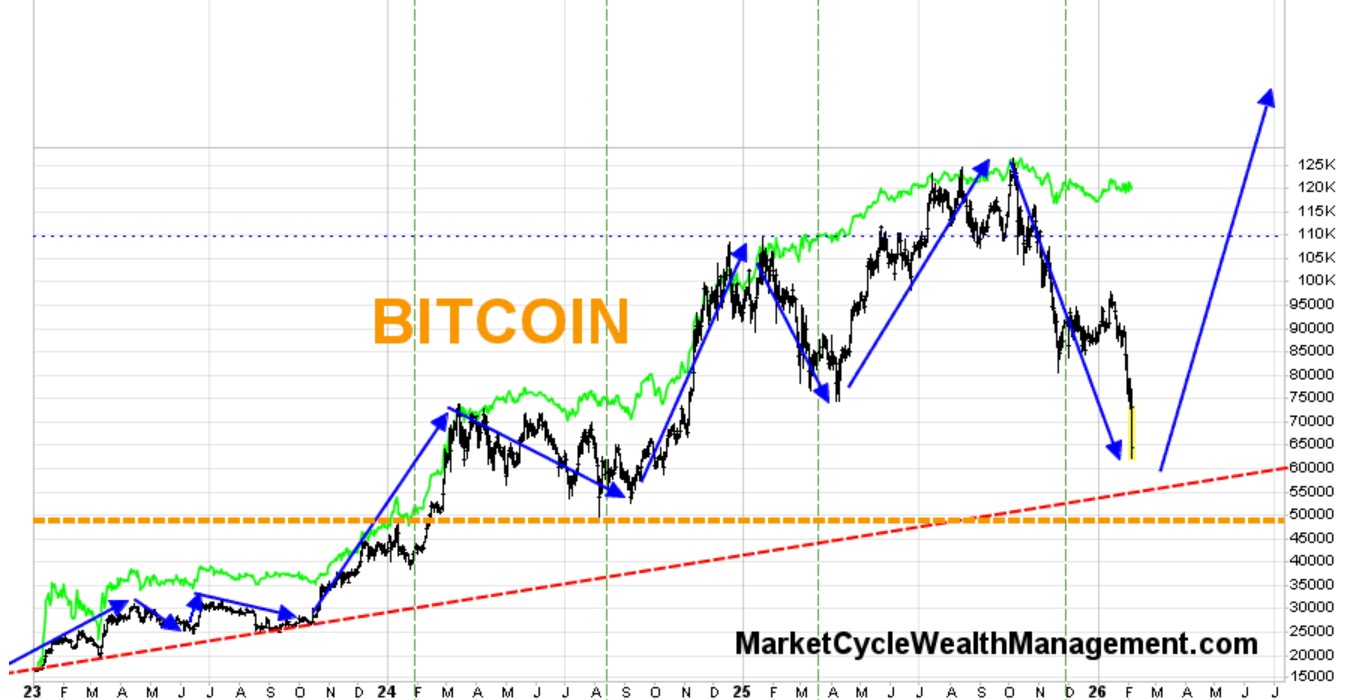
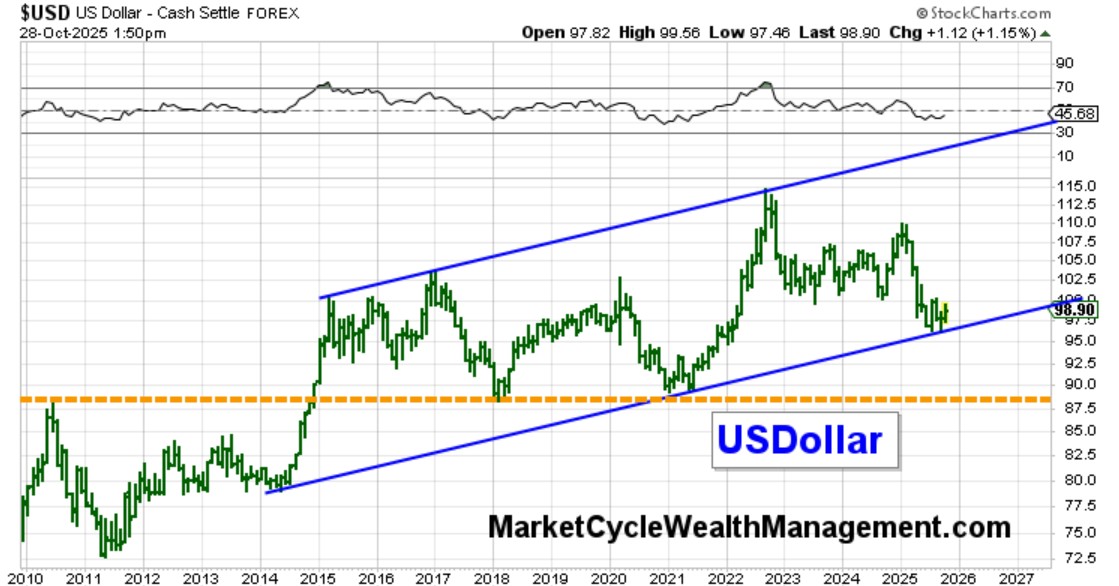
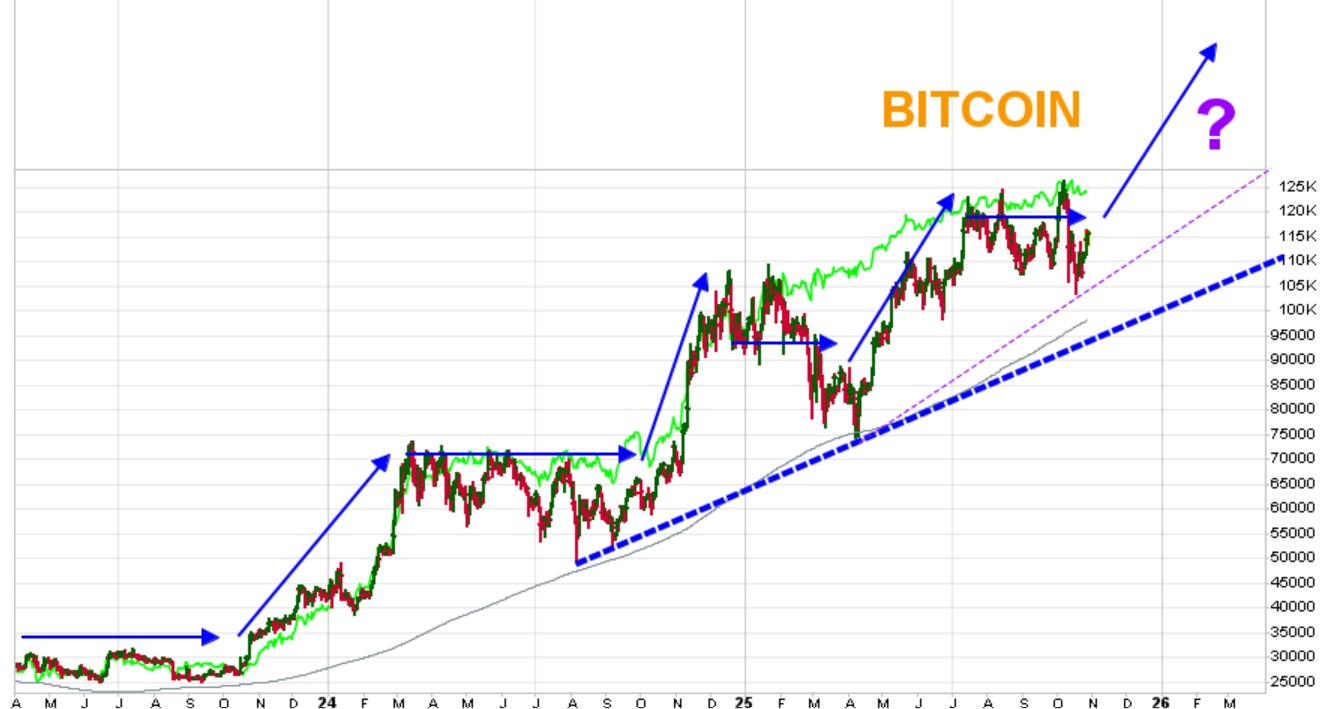
SUMMARY: War is easy to start and difficult to end. This oil disruption will not actually end when President Trump declares a “win” and halts the bombing (although there may be a temporary bounce higher in the stock market). Even if a “win” is declared tomorrow, it will still take much of the rest of 2026 for the economy to heal from this self-inflicted wound. The stock market may remain volatile until early-Fall… but it also might regain the losses by year’s end or very early in 2027. Until then, the war is holding the entire globe hostage. I am watching our proprietary “recession indicators” closely and we already hold a fair amount of protection on client accounts (which is good for us, and we did so with no negative tax consequences). Going forward, commodities, gold, bitcoin, USDollar and our protective assets may all move higher even as stocks drop; there is a reason to diversify into assets that are bullish in their own right.
An economic recession is becoming more and more likely.
MarketCycle does not want to sell most of our “themed” long positions, so we hold a lesser amount of “stronger” protective assets. If this were a 1987 style crash or a 2000 Dot.com Crash or a 2008 Great Financial Crash, then we would just get out of the market, as I did during the entirety of those three prolonged bearish periods. This is going to be a “lesser thing” when all is said and done… so we continue to hold our important long-term themes while also holding strong protection and some non-stock assets. Please remember that I am positioned exactly like my clients.
.
Thanks for reading.
Please consider allowing MarketCycle Wealth Management to help with your investment portfolio management. We work hard to earn our keep, especially in difficult markets.
.
.