
All charts were posted on October 28th and published on November 1st. This posting is mostly pictures and charts, so it is shorter than it seems. There is a PDF and print function at the bottom of this posting, on the website.
.
It is an exciting time in the markets… well, at least for me it is. I feel as if I have an inside peek at what will happen during the coming years, although I treat each day’s and each week’s analysis as if I could be entirely wrong.
I’ve been watching a particular chart of the Chinese stock market, shown below, for the past 10 years. I created the chart in 2015 and drew the suspected trendlines out into the future. On October 27, 2025, China FINALLY shattered through its extreme long-term bear market trendline (see the purple circle below, middle-right) and the breakout has held. Chinese stocks are extremely undervalued considering the extreme size of its economy and the giant monetary stimulus that they are planning to release, plus the most recent Trump-Xi trade negotiations are behind us for the next 6 months (next planned meeting is in April of 2026).

.
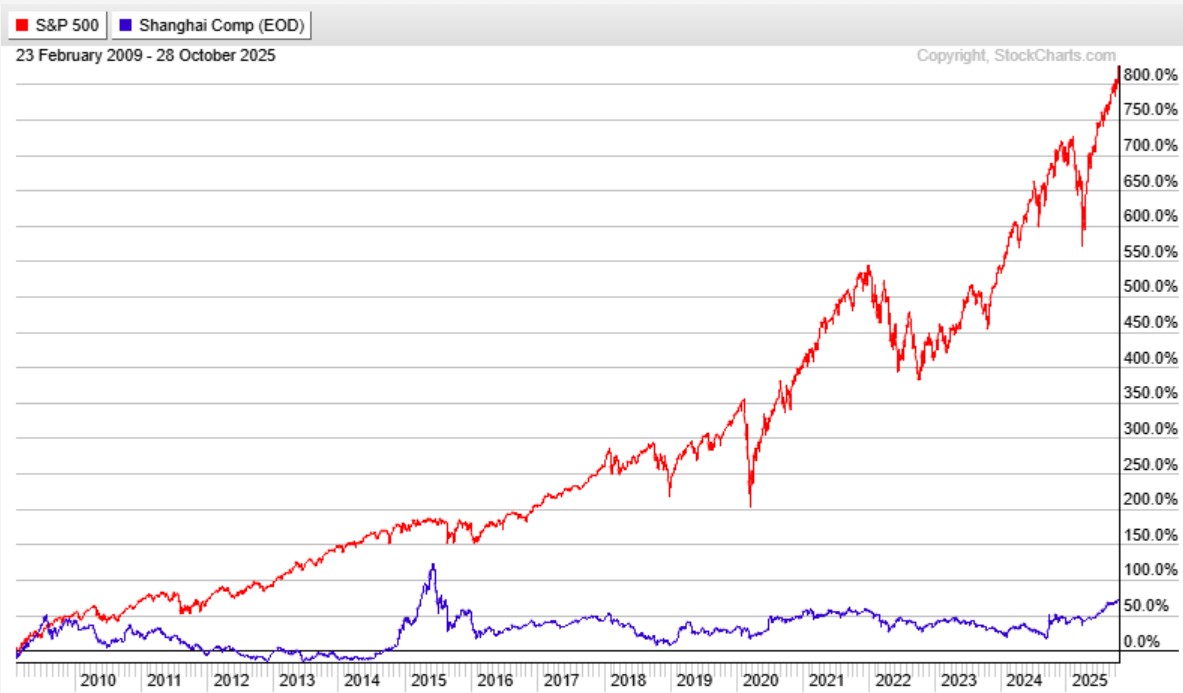
The below Performance Chart shows the gains of the S&P-500 (in red) compared to the Chinese stock market (in blue) since the beginning of this current Secular stock bull market in late-2008. Obviously, until now, the U.S. stock market was the only place to be invested. What we need to understand is that the investable market is now broadening out to include developed markets and China.
.
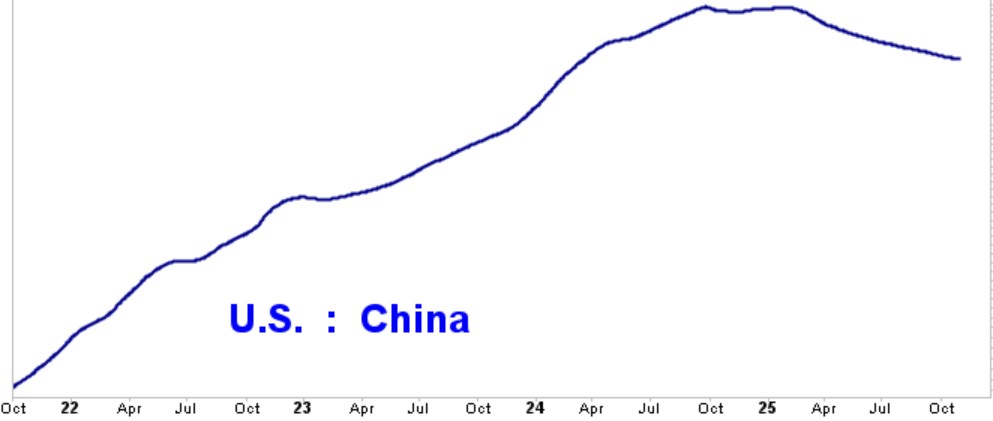
I have created around 200 (all similar) relative strength charts, covering all assets, that I can rapidly scroll through that show relative strength based on the trend direction of just one line on the chart (as shown below). Relative strength tells us how strong one asset is as compared relative to another. In the case below, we see how strong China is as compared to the S&P-500. When the line is moving DOWN, as it is currently doing, then the China stock market is projected to be stronger than is the U.S. stock market over the intermediate term (several months or possibly longer). I have to admit that a year ago I did not expect to see this much positive momentum in China, but it partly has to do with the weakening of the U.S. economy over the past 10 months while China’s economy is strengthening.
On this chart… line down = China up.
.
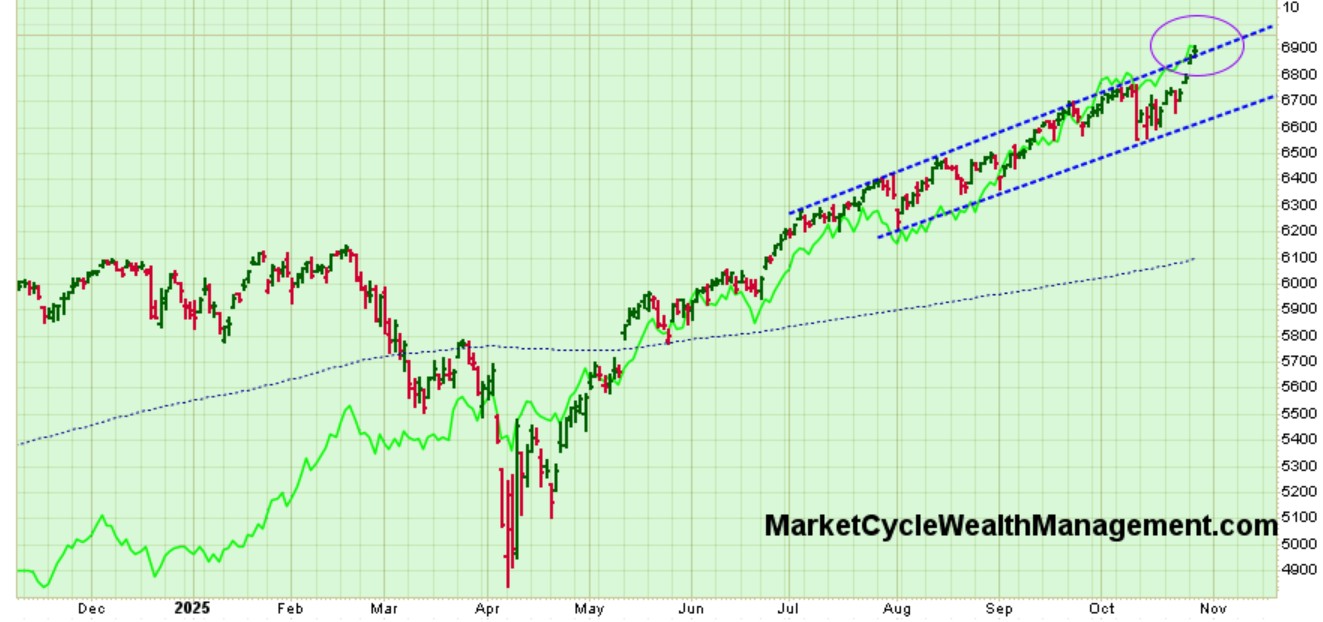
In the United States, the S&P-500 will very likely reach more than 7000 before year’s end. There might be some near-term volatility and chop… the shown blue dashed trendline channel is too narrow to be of much longer-term importance. The true trend channel cannot be seen on this one-year long chart.
.
Originally released on January 1, 2025, these are the end-of-year S&P-500 “projected targets” given by the major U.S. institutions; most will likely be wildly wrong. FundStrat Research and Ned Davis Research, both of which I subscribe to, projected 6600 but we are already over 6900 as I post this article.

.
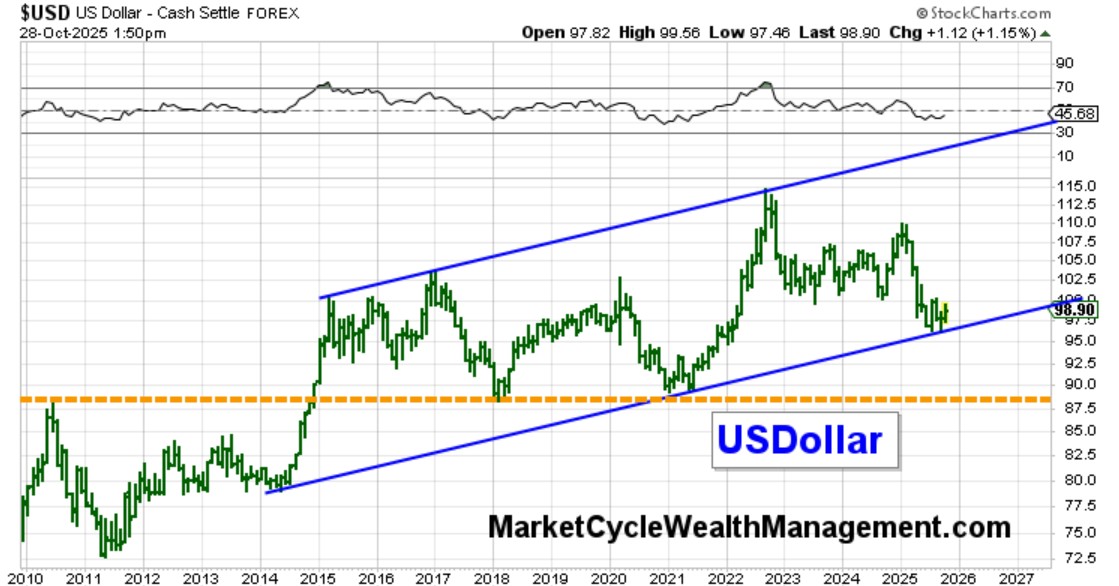
The USDollar is still holding within the walls of its BULLISH 12-year trend channel, but it warrants careful watching. The USD is slow moving; it ultimately may just gyrate sideways within a range of 89 to 115 for several more years into the future.
.
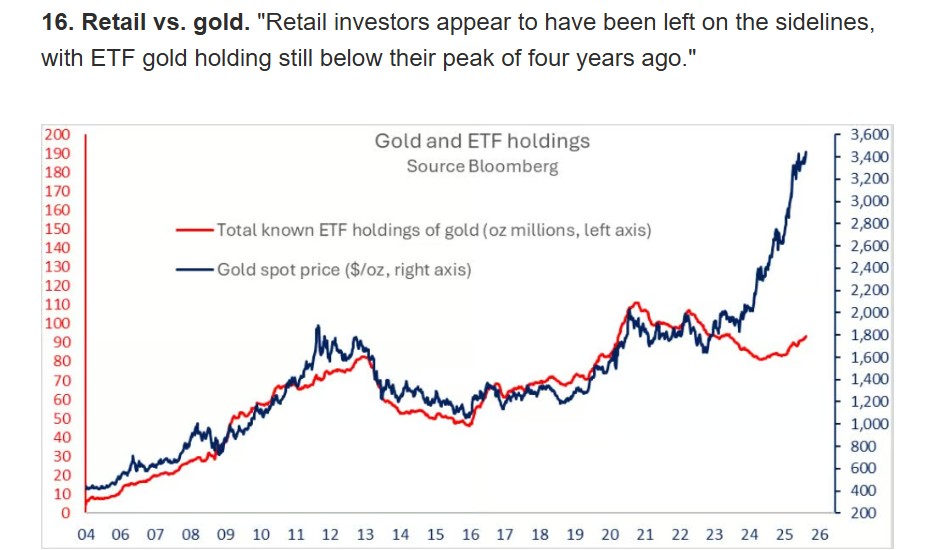
October 31st Bloomberg headline quoting Bank of America’s head strategist, Michael Hartnett:

.
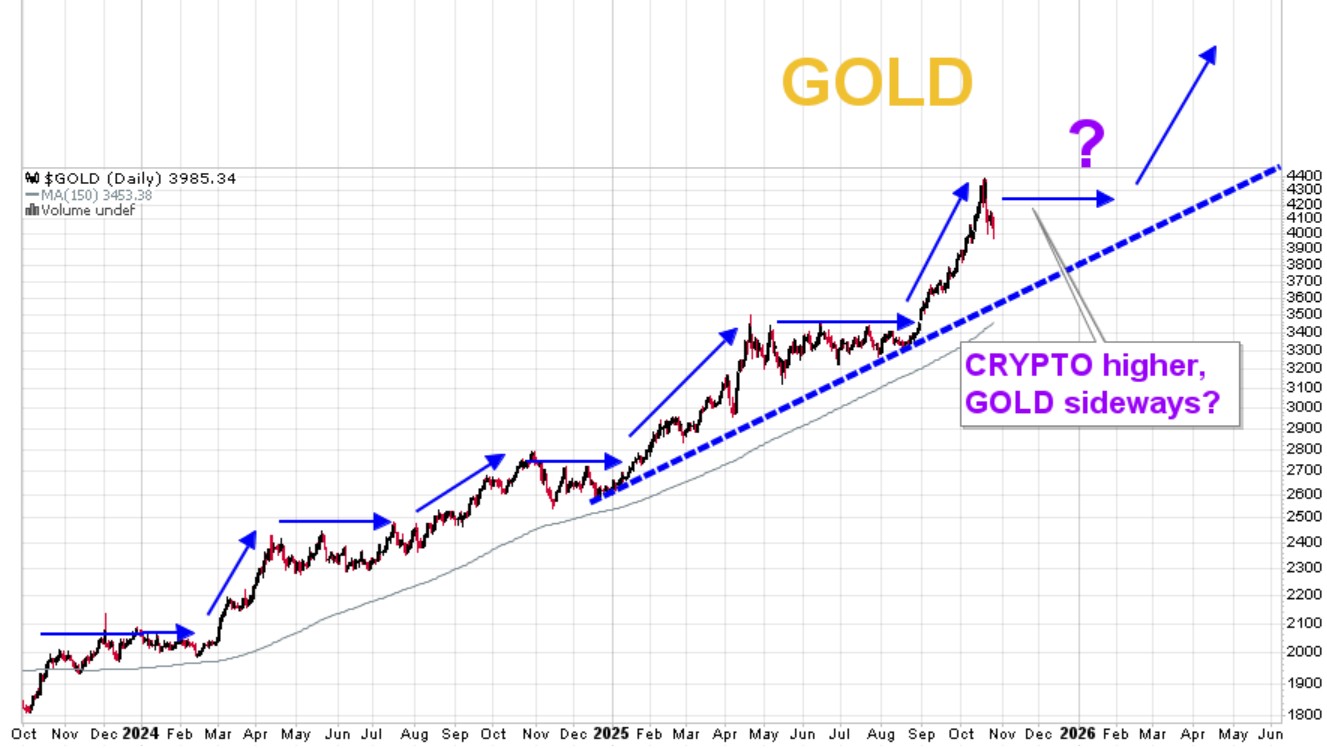
Gold is also suddenly taking a breather; it might gyrate sideways over the coming months, creating a series of higher lows within a fairly tight range as it did earlier this same year. It tends to jump higher and then slide sideways and then jump higher and then… But over the long-term, it will likely churn much higher. [Goldman Sachs projects that gold will move higher to hit $4900 by year’s end.] When we look back ten years from now, gold might be seen as the strongest and safest long-term asset. It is moving generally higher under activity that will remain favorable for gold… debasing the USDollar, increasing government debt, increasing market volatility, deregulation of assets and slowly increasing general inflation.
.
Gradually and over time, there are a lot of retail buyers (red line below) and Central Bank buyers of gold (gold = blue line below) that will be forced to play catch-up, possibly driving gold prices higher for many years. Over the coming decade, I expect gold to eventually go much higher than most people could even imagine. The U.S. Government is the one Central Bank that is not buying more gold, we hold a lot already. Instead, the U.S. is buying (and seizing) crypto currency.
.
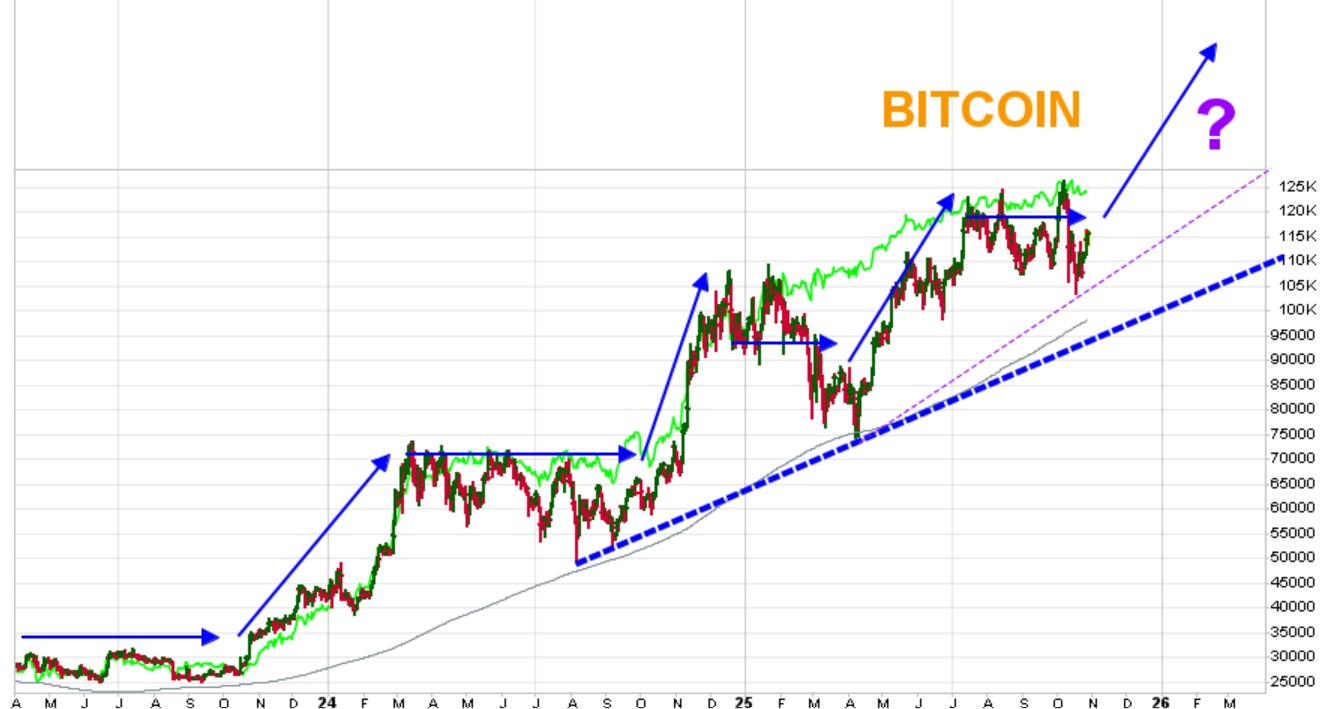
Whenever gold temporarily weakens, bitcoin often takes the lead and moves higher; bitcoin and gold are sort of like a tag team. One does well while the other one rests and then they switch. Like gold, bitcoin also tends to move higher, then sideways, then higher, then…
After a bit more near-term turmoil, bitcoin may soon head higher again, perhaps to $150,000(??). MarketCycle’s client accounts hold twice as much gold as we do crypto and this is because crypto is twice as volatile as is gold.
.
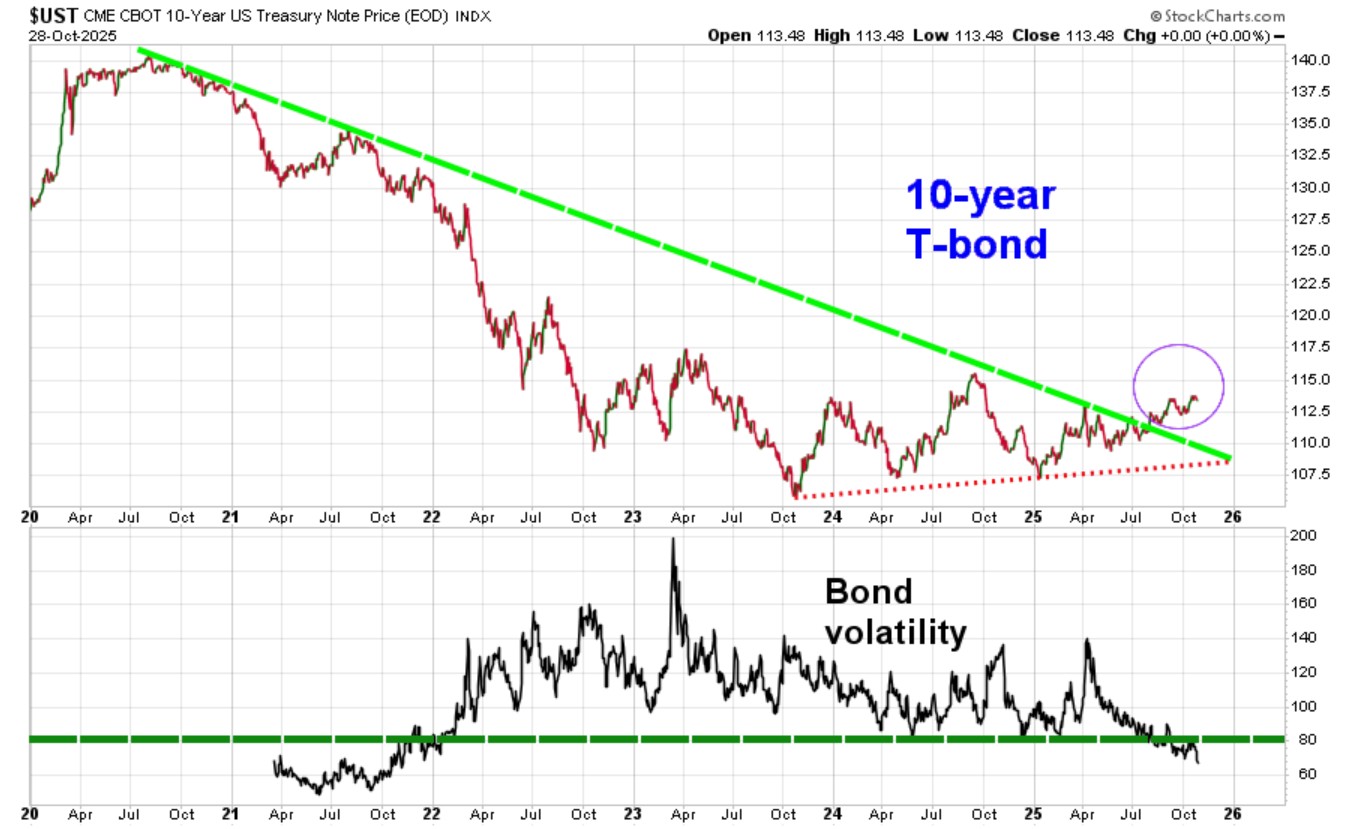
Bonds have also recently shattered through their 6-year long bear market trendline and bond volatility is finally back in the low-risk area. This allows us to add bonds back into portfolios, with high-quality corporate bonds being (unusually) less risky than are government bonds. Again, see the purple circle:
.
Most professional investors now believe that the Fed will not lower interest rates at its next announcement meeting in December, but they may be forced to do so if the employment situation worsens. It is not just tariffs; even though AI is still at its beginning stages, it is adding to job losses at a more rapid rate than most people anticipated and Federal Reserve Chairman Powell fully understands this.
Headline from this week’s Fortune:

.
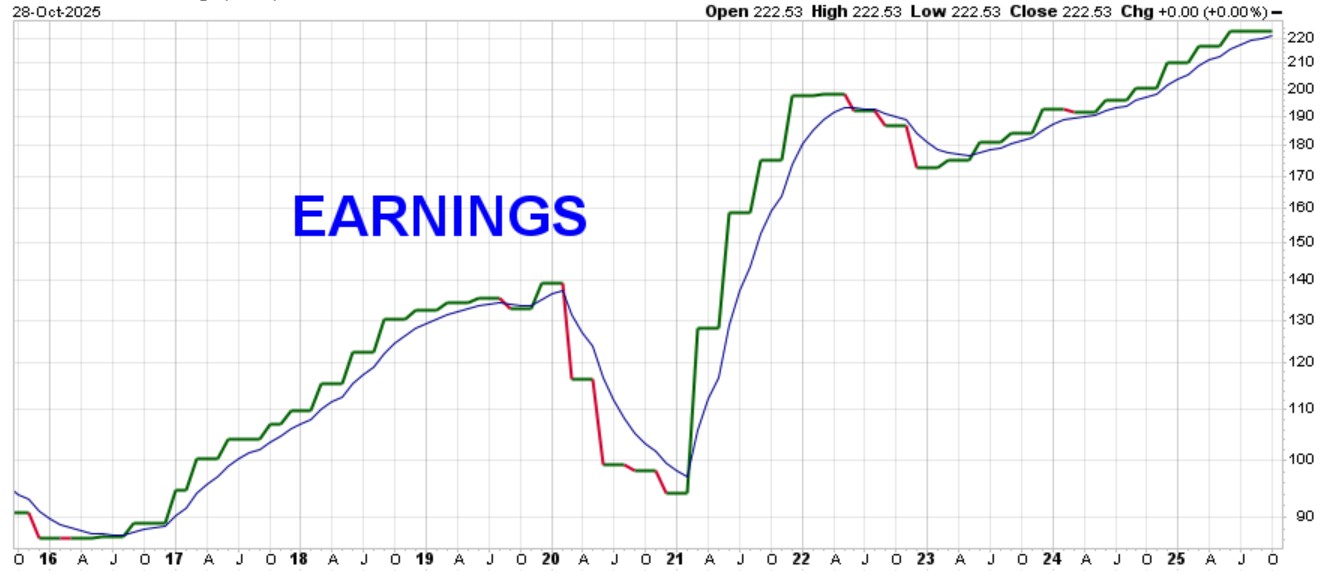
The all-important corporate earnings are still climbing higher. Stronger corporate earnings = stronger corporate stocks = stronger stock market.
.
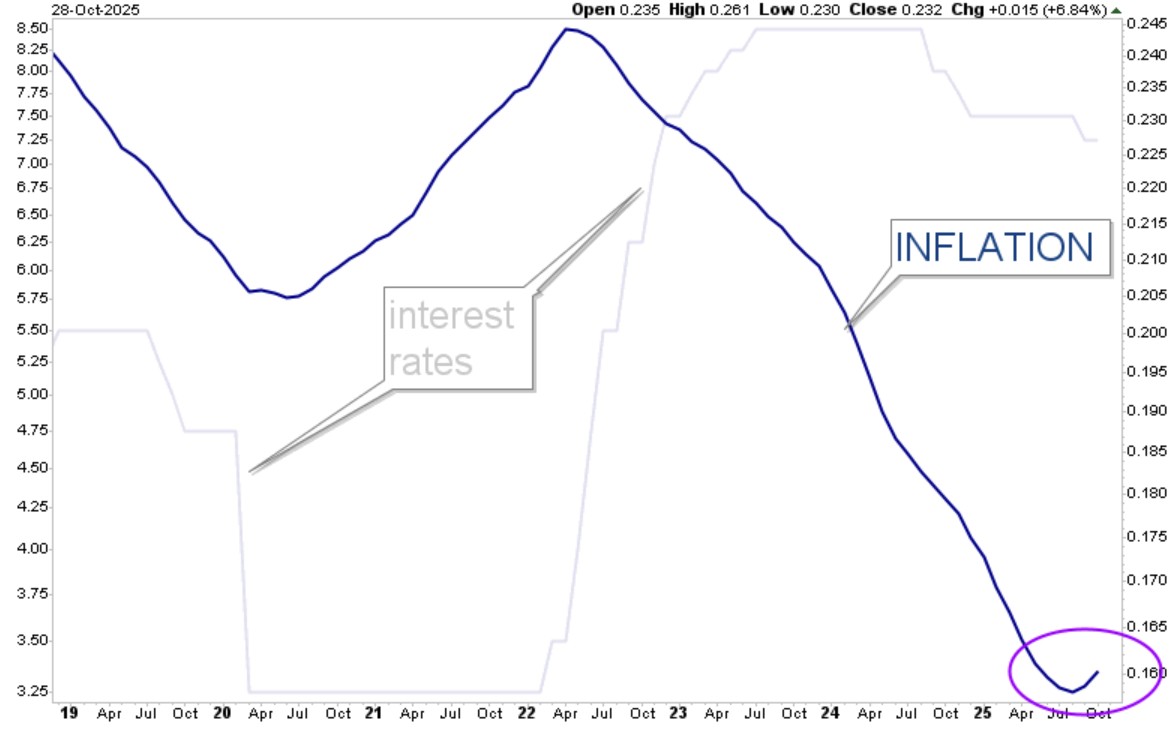
And finally, MarketCycle’s sensitive inflation indicator, that turns a ton of data into one simple line on a chart, is now turning higher again (blue line below). It is designed to make early calls about the path of inflation, before other investors see what’s happening. Inflation is generally caused by tariffs, debt and money printing; we have all three in abundance.
Gray line = Fed… blue line = inflation… they should almost be running in sync, and they are not because the Fed is always late to respond. The purple circle shows the recent turn-up in inflation. This means that the Fed should actually stop lowering rates unless the jobs numbers worsen… but they won’t ask for my opinion.
.
SUMMARY: I remain a broken record… I am still bullish… I am still bullish… I am still bullish!
That’s it and thanks for reading!
MarketCycle Wealth Management does this: We use our decades long experience to navigate your investment account through rough waters while following secular macro themes. Over the longer term, the stock market ultimately moves on themes, trends, momentum and factors… not on individual stock selection.
The great Peter Lynch didn’t “buy stocks,” he bought one factor: momentum.
And Warren Buffett didn’t “buy stocks,” he actually bought one factor: large-cap quality-value.
MarketCycle is affordable and we try hard to earn our keep. We often know things ahead of the crowd that most others simply miss. MarketCycle listens to a lot of smart people and we subscribe to some of the most elite research advisories, but we ultimately make decisions based on our own clear and accurate indicators coupled with an experienced understanding of global-macro and market-cycles… and a lot of common sense.
Yes, we are accepting new clients, and you will never see a better time to invest than right now.
.

.
.