MarketCycle Wealth Management

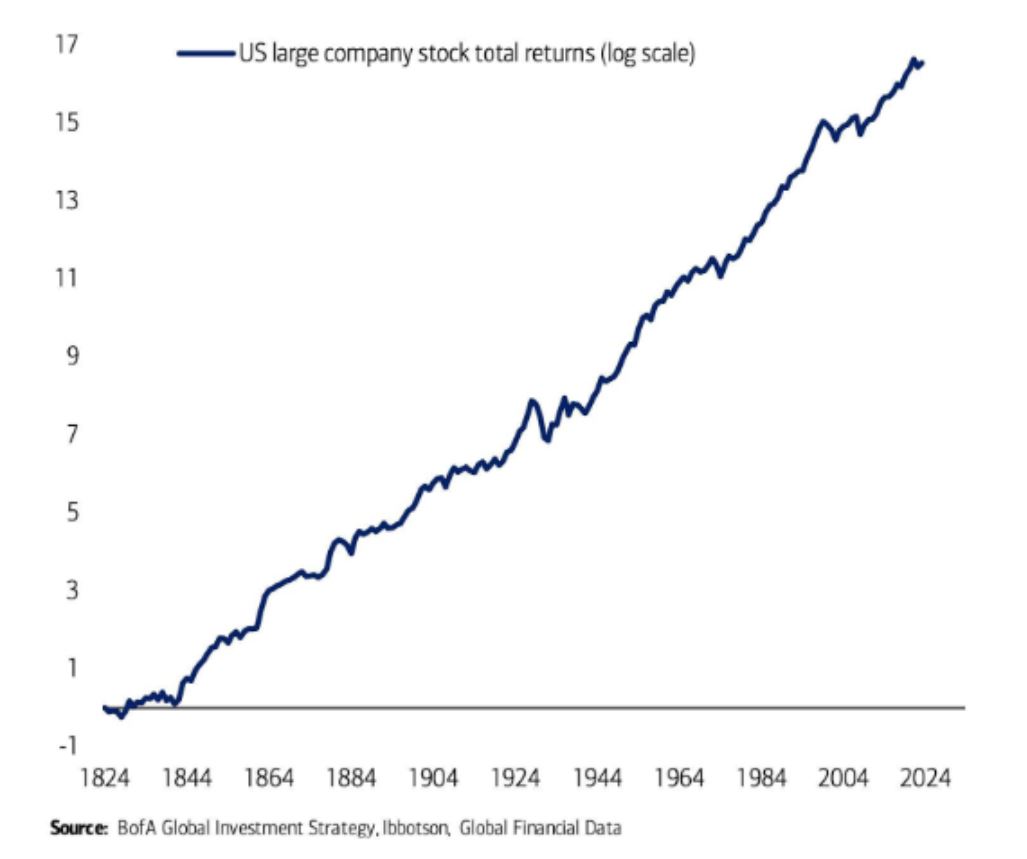
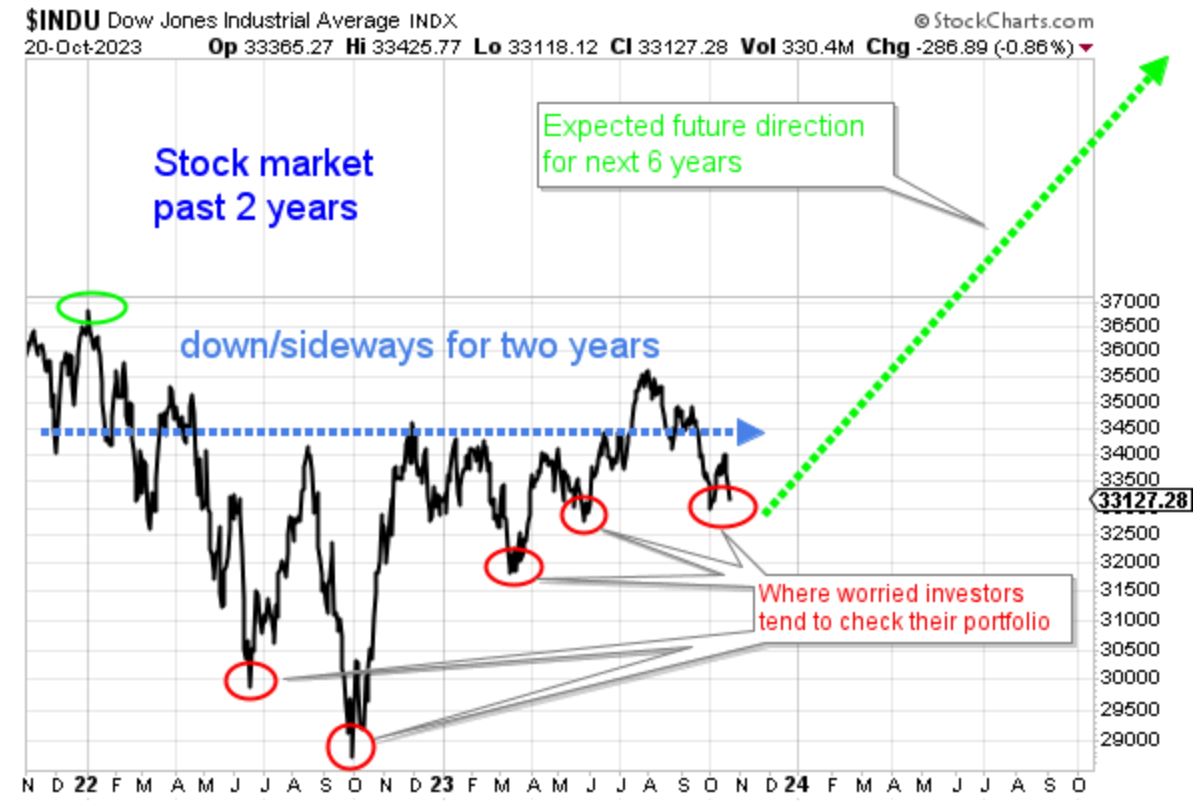
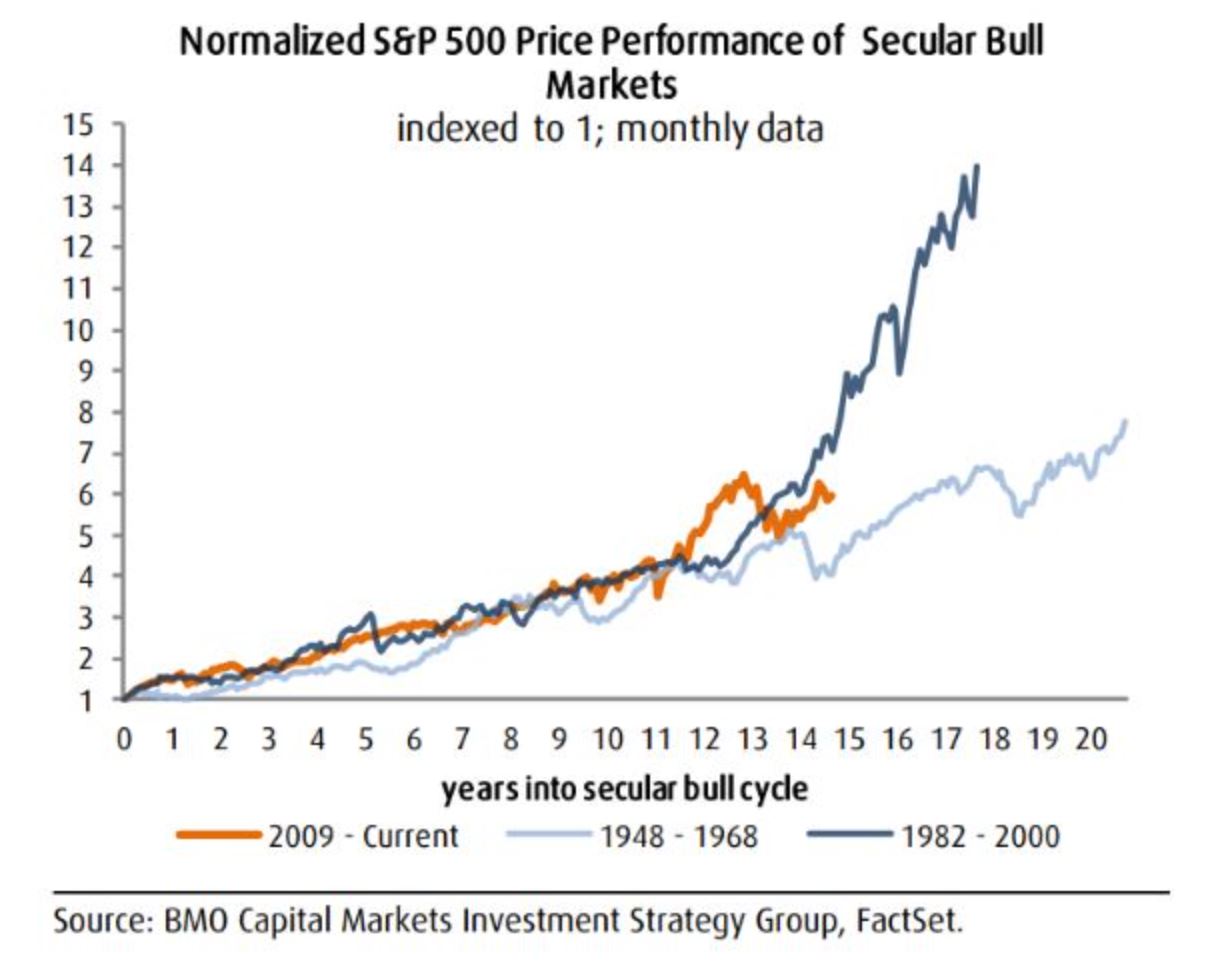
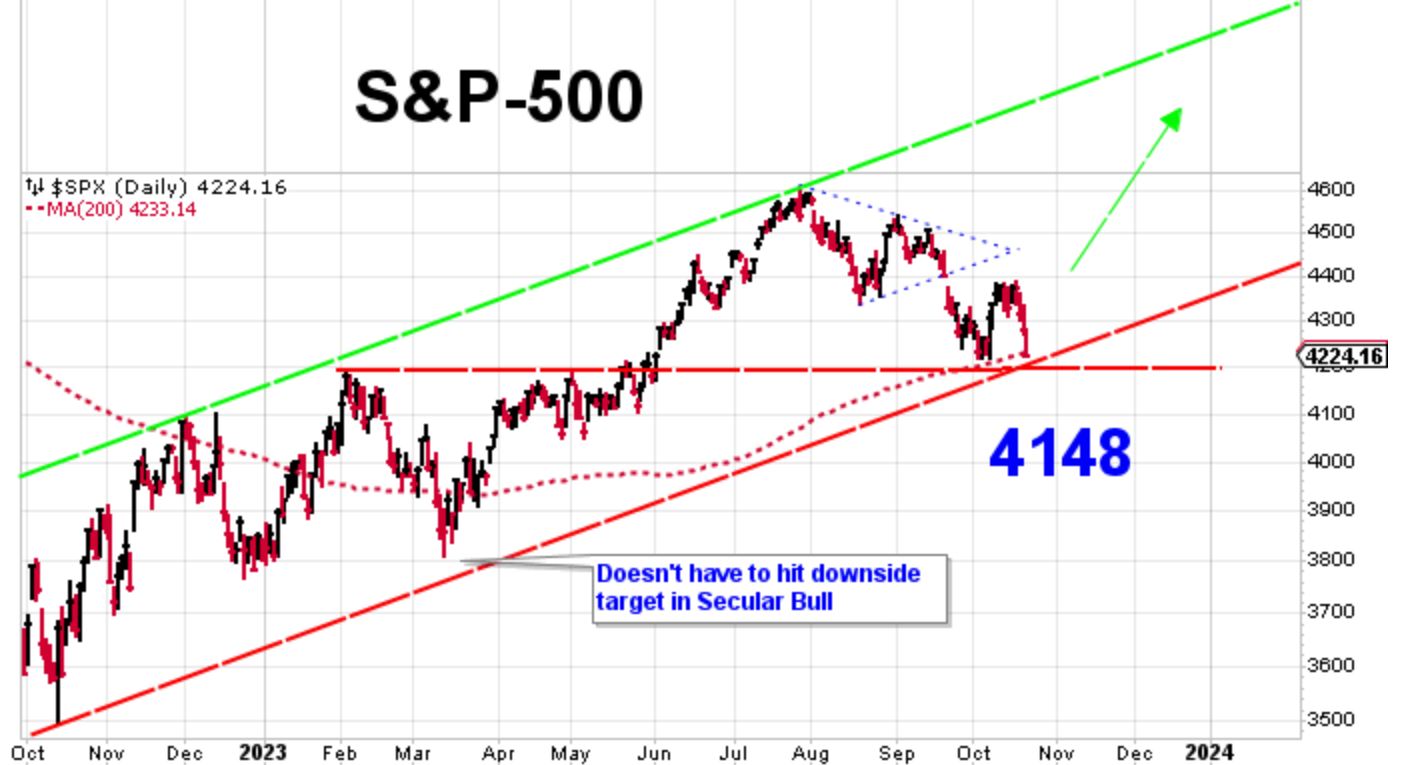
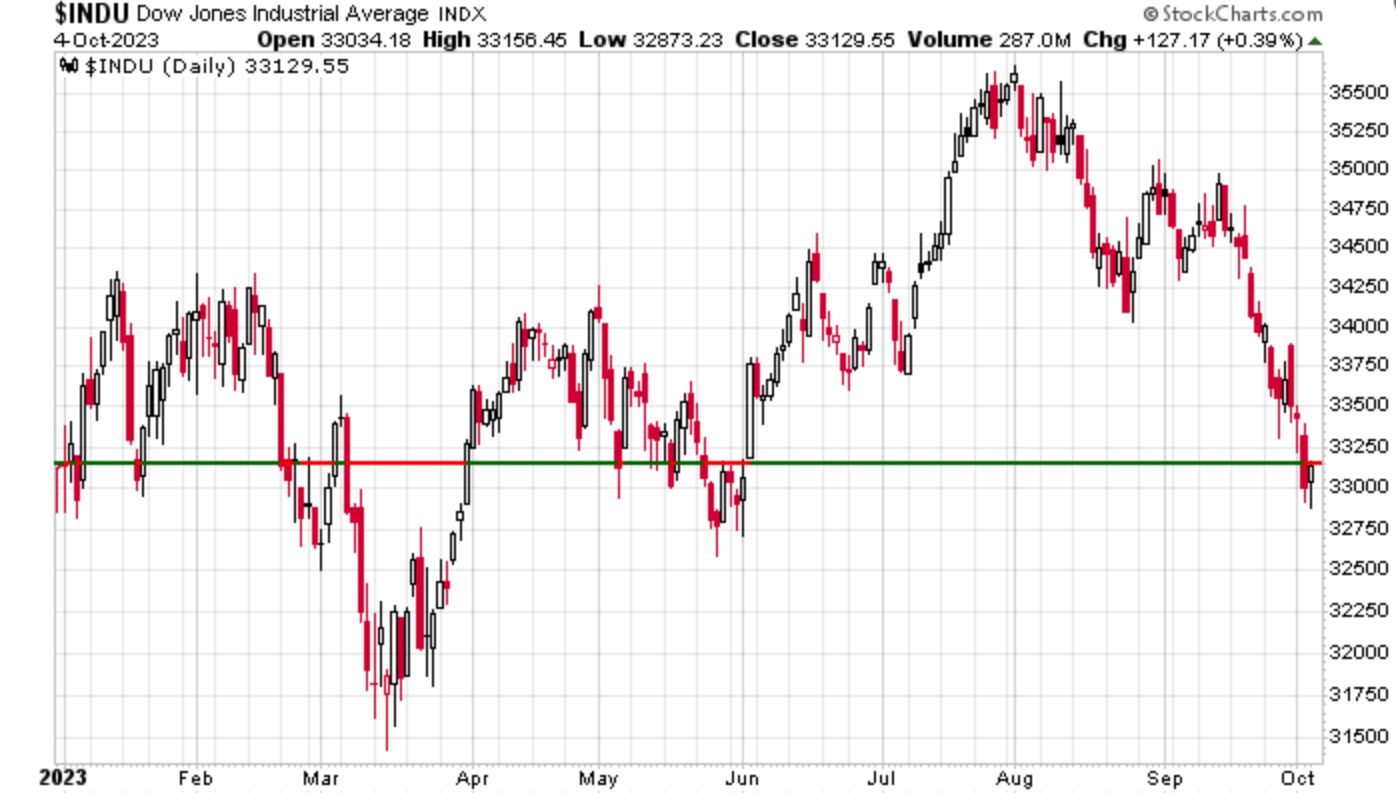
Regardless of popular opinion, or should I say “popular worries,” we are not in a stock market bubble and in fact, quite the opposite exists; undervalued assets are abundant. A new cyclical stock bull market began in October of 2023 despite the market bottoming one year earlier in October of 2022. So, today, we are only five months into a brand new five year bull market. As always, periodic temporary pullbacks or slightly longer sideways consolidations will be needed (and will occur) along the way. These prevent bubbles from forming.
We are not waiting for the inevitable recession, it already occurred via a rare rolling recession where, just as in the game of “Whack-a-mole,” varying rising assets were knocked down, one after the next; it occurred from October of 2022 to October of 2023. In my opinion, and almost nobody agrees with me, the recession is ALREADY over.
Starting months before the Fed first lowers rates, certain assets normally begin to outperform. So, these assets needed to be purchased ahead of time, not after the fact. MarketCycle holds a portfolio of currently strong assets along with other assets that are just now showing their strength. Sometimes we have to buy low and patiently wait, knowing that outsized gains will eventually come our way and that the leaders will eventually lag as other assets take over leadership. The exception may be in artificial intelligence stocks, which are here for the long term.
Projected stock sector ratings for 2024 as compared to just owning the S&P-500:
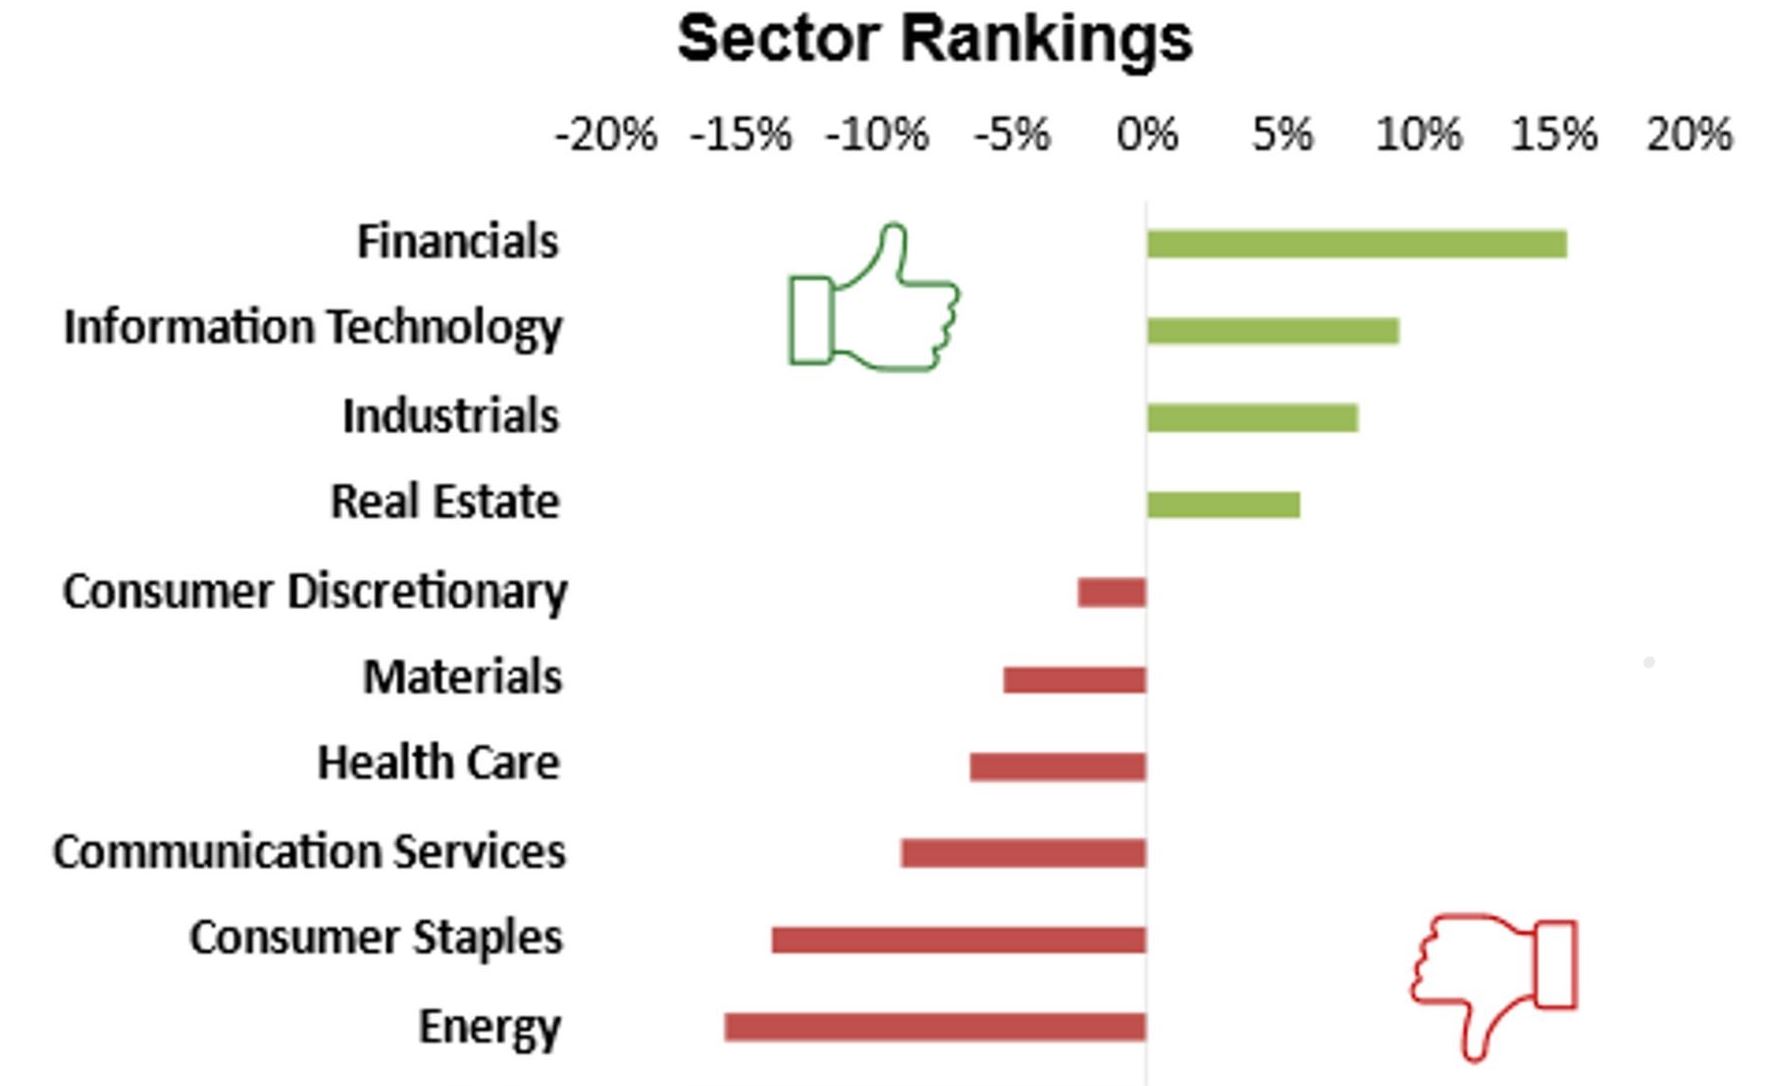
.
We have a fairly simple roadmap:
INTEREST RATES:
- MarketCycle predicted a series of 2024 rate cuts while everyone else was still saying that inflation was here to stay. We stated that there would be 3 rate cuts. Wall Street eventually said “7” and then “5” and they are now calling for “3.” On March 20th, the Fed announced that there will be 3 rate cuts in 2024.
- I currently expect rates to begin their “3-cut” decent in early summer.
- In my opinion, after the first 3 cuts, future additional cuts will be slow to arrive, with the Fed trying to reserve its valuable ammunition. They will reserve most of the rate cuts to use whenever the stock market shows signs of weakening. This is extremely bullish.
- Of note: Morningstar, who offers exceptional investing research, is just now raising their prediction to 5 rate cuts in 2024.
INFLATION:
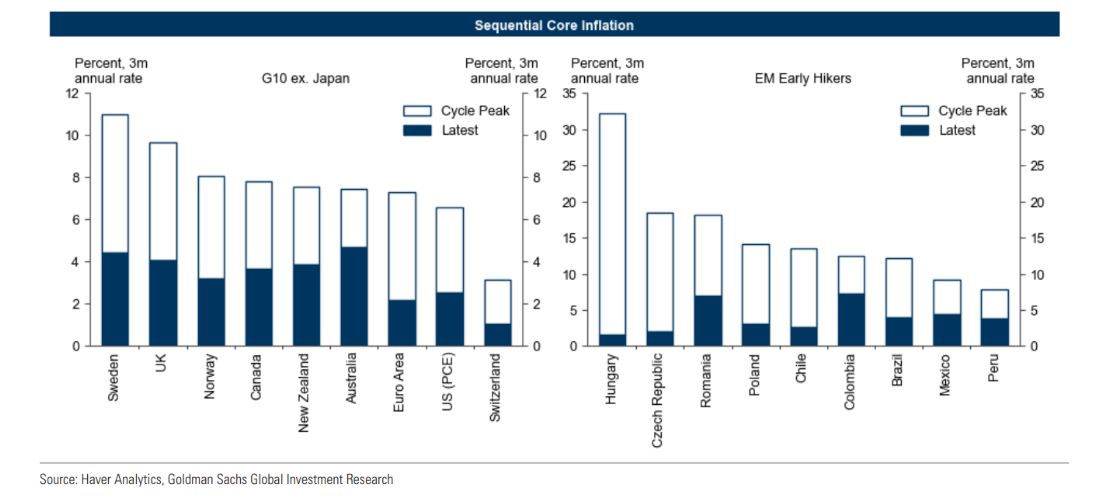
- MarketCycle saw the coming high inflation before anyone else, way back in late 2020. We also perfectly called the top in inflation. Over a year ago we also said that…
- Inflation, even if it first goes back to 2%, it should level off (higher) at 3%.
- I expect a second bout of slowly building inflation in a few years, perhaps in 2027(?).
- I believe that we get stagflation in the 2030’s, but there are definitely ways to exploit and profit from stagflation. The rising price of gold is already showing us that a period of stagflation is in our distant future.
STOCKS:
- Stocks are not in a bubble; only a handful (out of thousands) of stocks are overvalued.
- “Buy-&-Hold” of the S&P-500 or Nasdaq-100 is now dead. Asset selection is suddenly important.
- The U.S. still leads in relative strength. India and Japan are likewise strong. It worries me that the Japanese government owns the majority of the stock shares in their own country’s stock index, propping it up. MarketCycle does currently hold a 4% position in Japanese momentum stocks. It also worries me that the India stock market is so lofty. When buying an asset we have to ask how many people are left to buy into the idea. Apparently a lot of people have already bought into the Indian stock market, so how many more investors are left to drive continued outsized gains?
- China is a dead stock market for the longer-term, despite any temporary bullish head fakes.
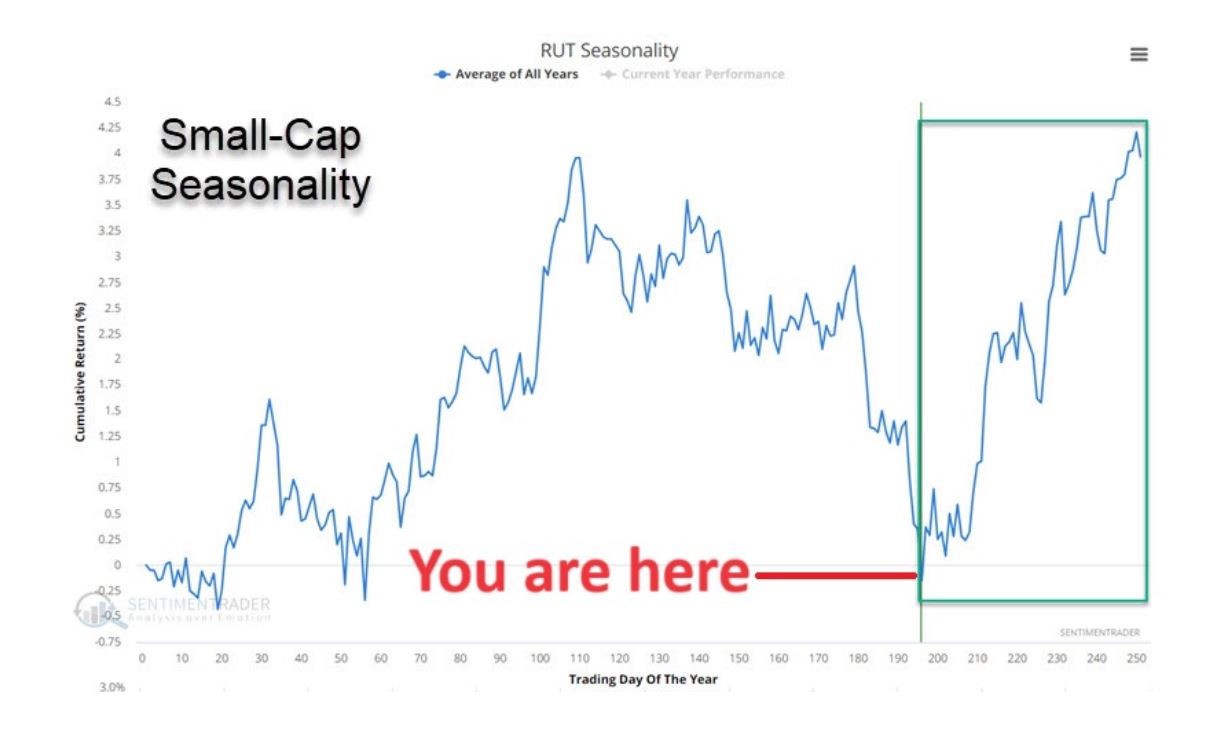
- Before the Fed lowers rates, interest-rate sensitive sectors and factors, early-cycle sectors and factors and quality small-cap stocks will (are) get their time to shine. Buy low, wait, sell high. Just this weekend (after my extensive weekend analysis) I can see the final confirming signs of stock market investors actually pulling away from large cap quality stocks and toward these new undervalued positions.
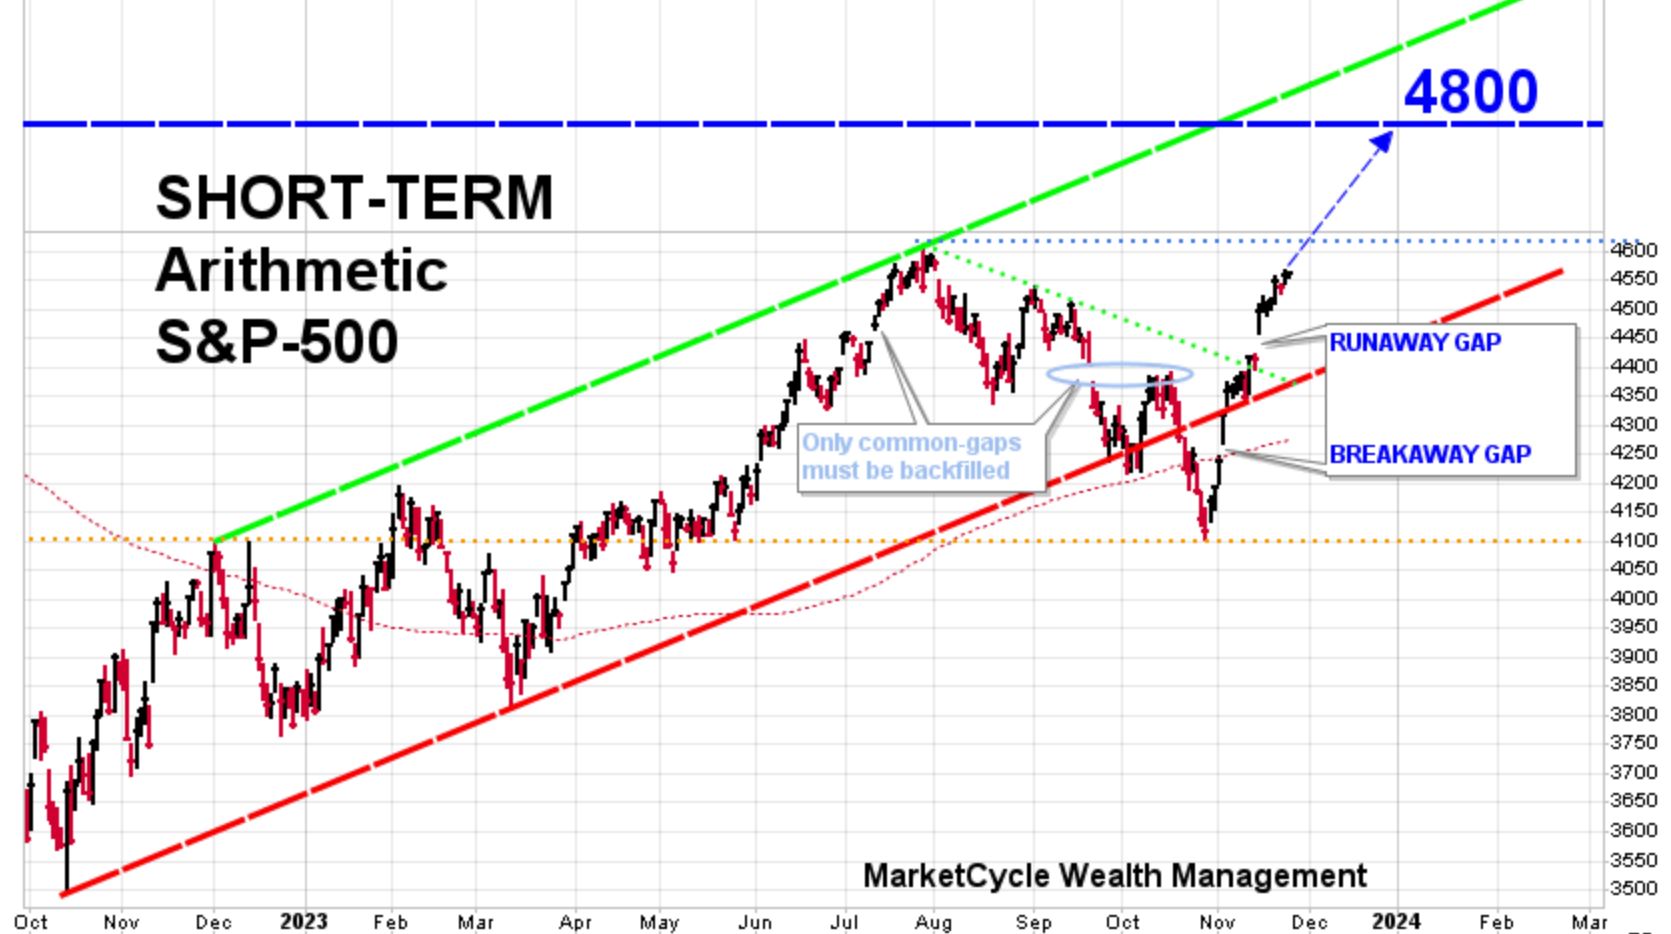
- We were literally the first to call 5400 as the high for the S&P-500 in 2024. Now almost all of Wall Street is raising their end-of-year price target to 5400. Only Societe Generale is higher as they, last week, raised their 2024 target from 4750 to 5500. We may also raise our predicted high for the year. Nobody knows where the year will end, no matter how much they pretend to be able to do so. MarketCycle seems to be fairly adept at predicting the absolute possible high point well ahead of time.
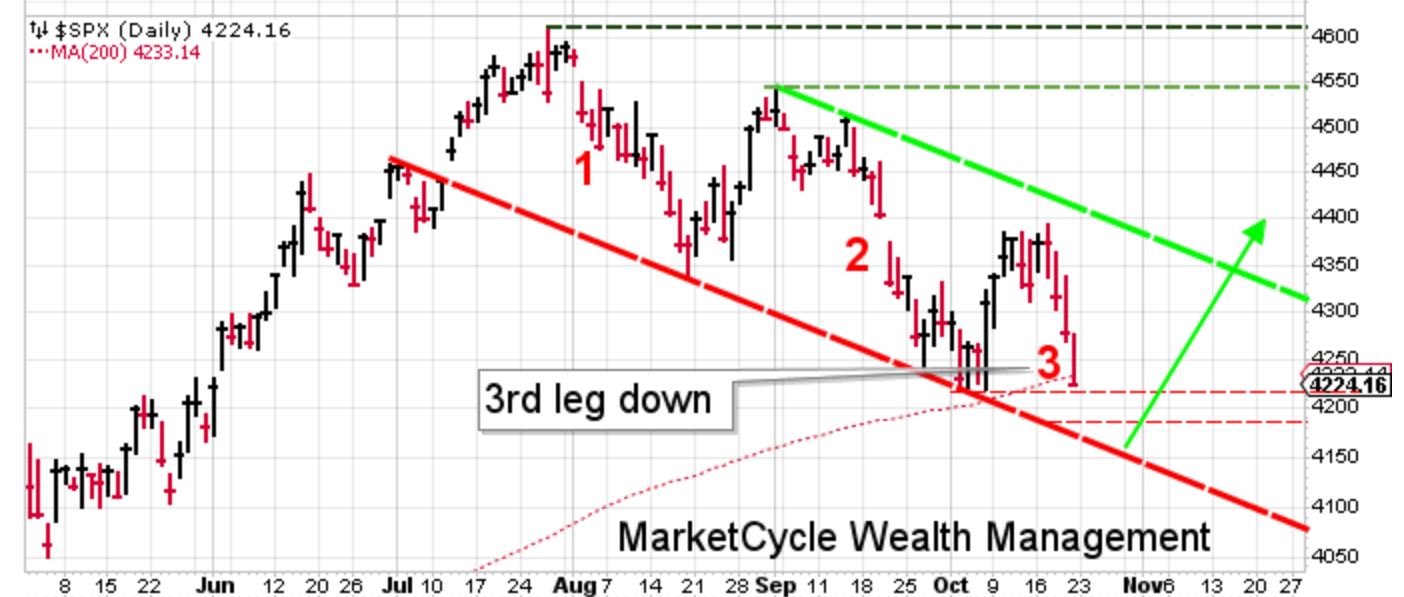
- Worst case scenario in any bigger and temporary pullback is for the S&P-500 to pull back to 4800, but I do not currently see that as an actual event.
- Our system is showing that any weakness in the very near-term would likely result in a shallow and temporary and less important pullback.
- We have been sending very accurate near-term market calls in private client updates. One very nice client out in the Philippines sent me a recent email comparing our market calls to the old TV show: “Steve Austin, $6-million man!”
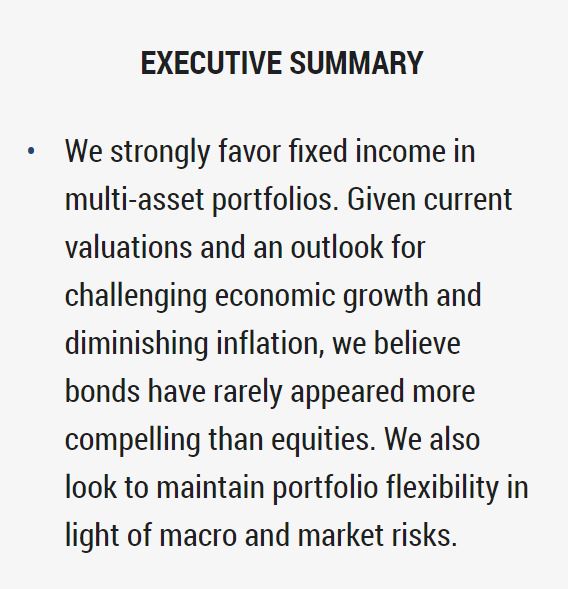
BONDS:
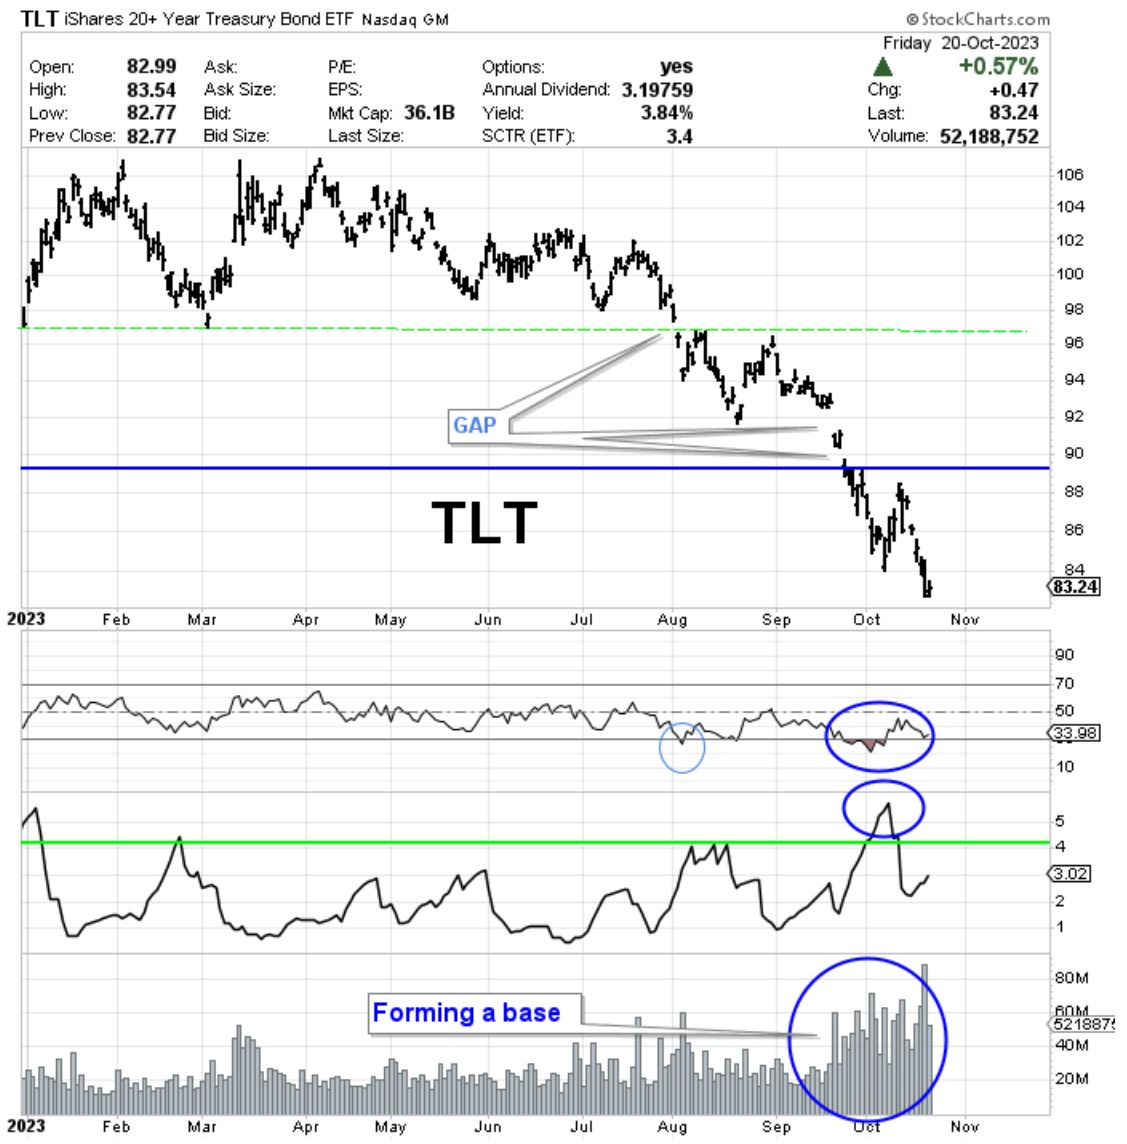
- Bonds go up in price as interest rates go down. Rates are about to go down. Period. End of story. Bonds will do well. In low or falling inflation regimes, bonds normally act as protection for investment accounts when stocks fall. Stocks down = bonds up. Bonds are protection that pays interest and they also offer price gains just like stocks do.
- “Buy-&-Hold” of bonds is now dead. For the next 15 years, tactical moves based on inflation and interest rate levels is now of critical importance.
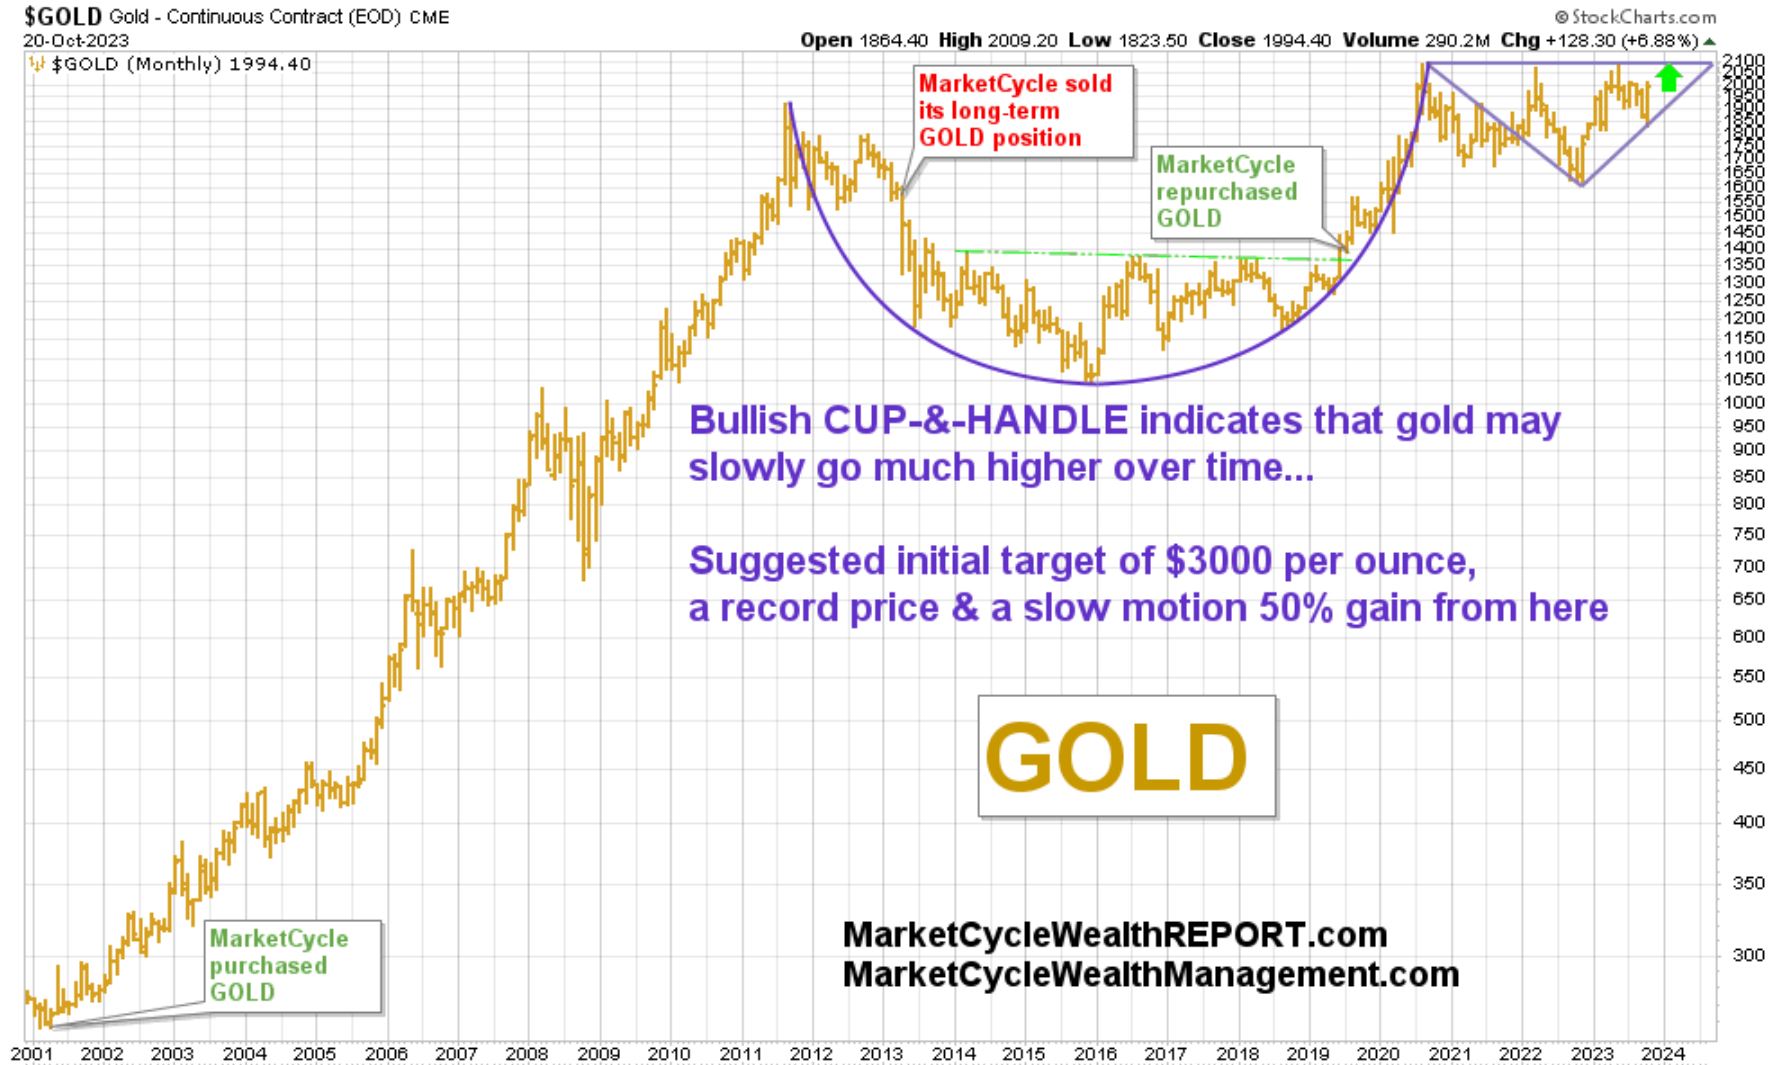
GOLD:
- Gold has broken (up) out of a massive “cup-and-handle” price chart pattern that took 13 years to form. It is going quite a bit higher based on a host of factors. By the later 2030’s, gold may be more important than is Bitcoin. MarketCycle client accounts hold a 7% gold position, safely held in the vaults of the Canadian Mint. If we sell, our tax consequence will be 50% less than if held in any other manner (one of the ways that I attempt to earn my keep).
BITCOIN:
- We bought Bitcoin at a low point (with a small allocation) and have ridden it up. Awhile back we added Ethereum (ahead of the creation of the new Ethereum ETFs). Both are likely to go higher despite the current lofty levels. When we eventually sell, we have a two pronged approach which will sell off half at our first signal and then the other half when the next signal is given. Buy low, sell high, and then buy low again. MarketCycle has developed a fairly sophisticated system for crypto buy & sells.
COMMODITIES:
- Commodities are a late-cycle asset. While they may have some moments of outperformance, their real strength remains a few years away, perhaps some time around 2027-ish.
ECONOMY:
- Corporate earnings are expected to continue to grow.
- Better business conditions are expected ahead, globally.
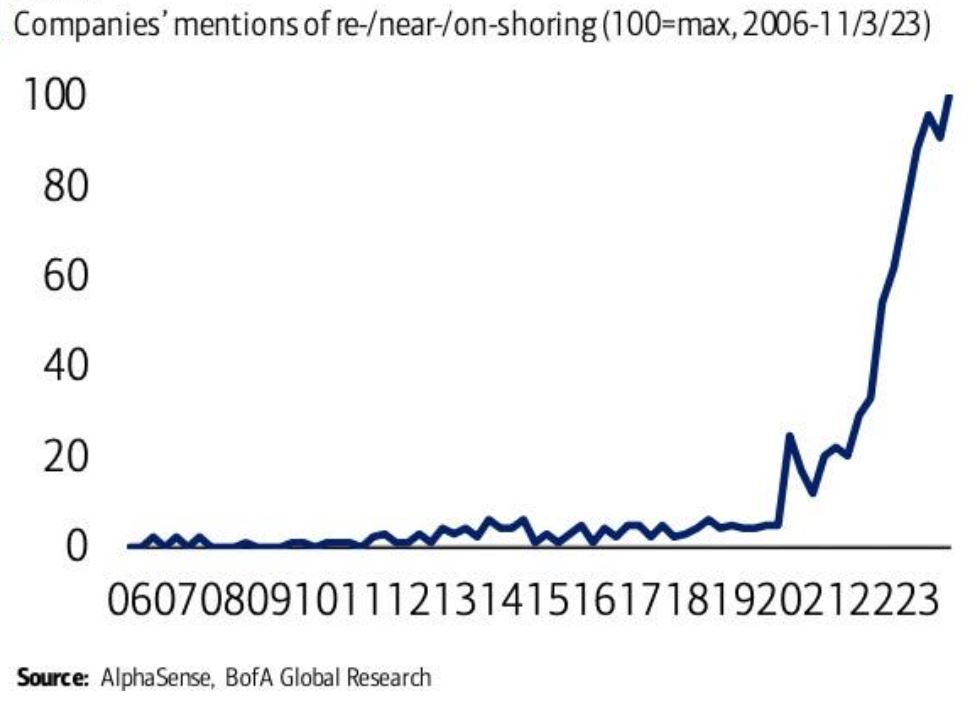
- Record numbers of manufacturing plants continue to be built in the United States.
- U.S. consumer debt remains low, so…
- Consumer spending remains robust.
- Home sales just flipped to a rising trend, so…
- Homebuilder sentiment just flipped back to bullish.
- Margin use remains low.
- Breadth is starting to rapidly expand, so all parts of the economy are getting stronger.
- U.S. Gross Domestic Product (GDP) is highest globally. We’re busy.
- Leading Economic Indicators (LEI) finally flipped back to bullish as of the December 2023 data (released in January 2024).
- Improved supply chains globally.
- New U.S. businesses starting at record numbers.
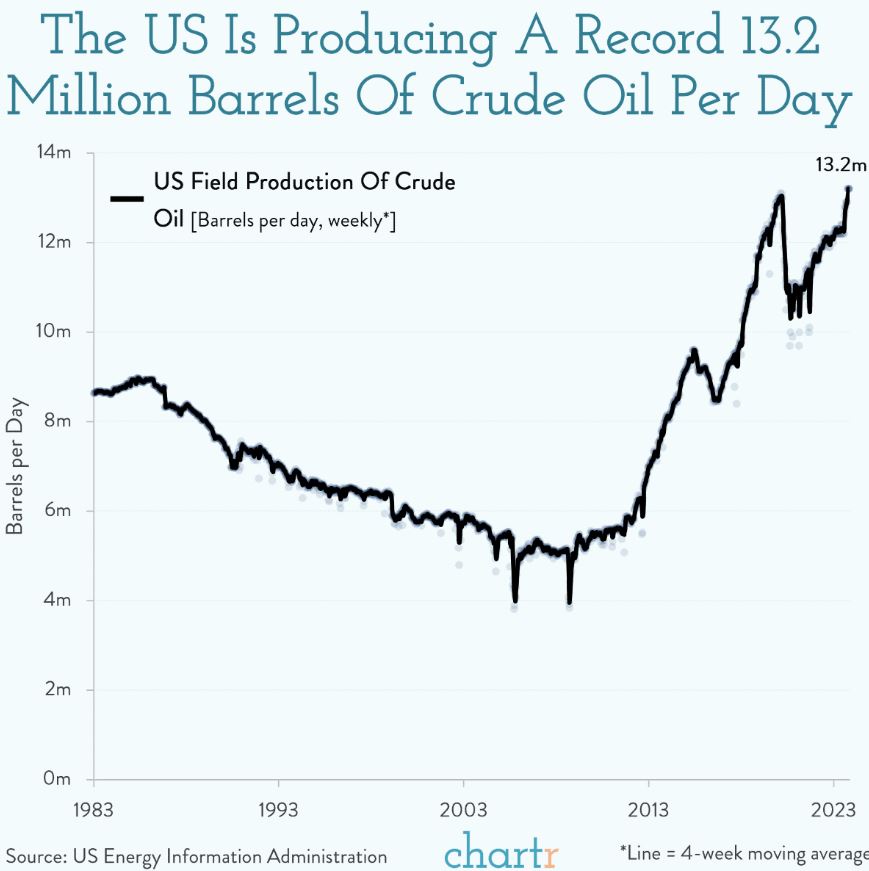
- Oil production in the U.S. is at record highs.
- As inflation comes down and as rates come down, the sovereign debt payments of most countries, including in the United States, becomes lower, and this is stimulative.
- The stimulative affects of Covid-19 financial relief remain intact.
- Government infrastructure spending is just now ramping up and this is also stimulative.
- Investing age demographics in the U.S. remain strong until the year 2029.
- Downside volatility has collapsed; this is longer term bullish for many assets and for the economy.
.
SUMMARY: Yes, MarketCycle Wealth Management is still bullish!
.
Thank you for reading!
MarketCycle Wealth Management is in the business of managing YOUR investment account or retirement account (IRA, ROTH or SEP). The process is easy. I work 24/7 and am always here to help. Most clients that call me do so on Sunday, which is fine with me. There is a contact tab at the top of our website.
Our weekly REPORT site is available via a link on our main website.
.

.